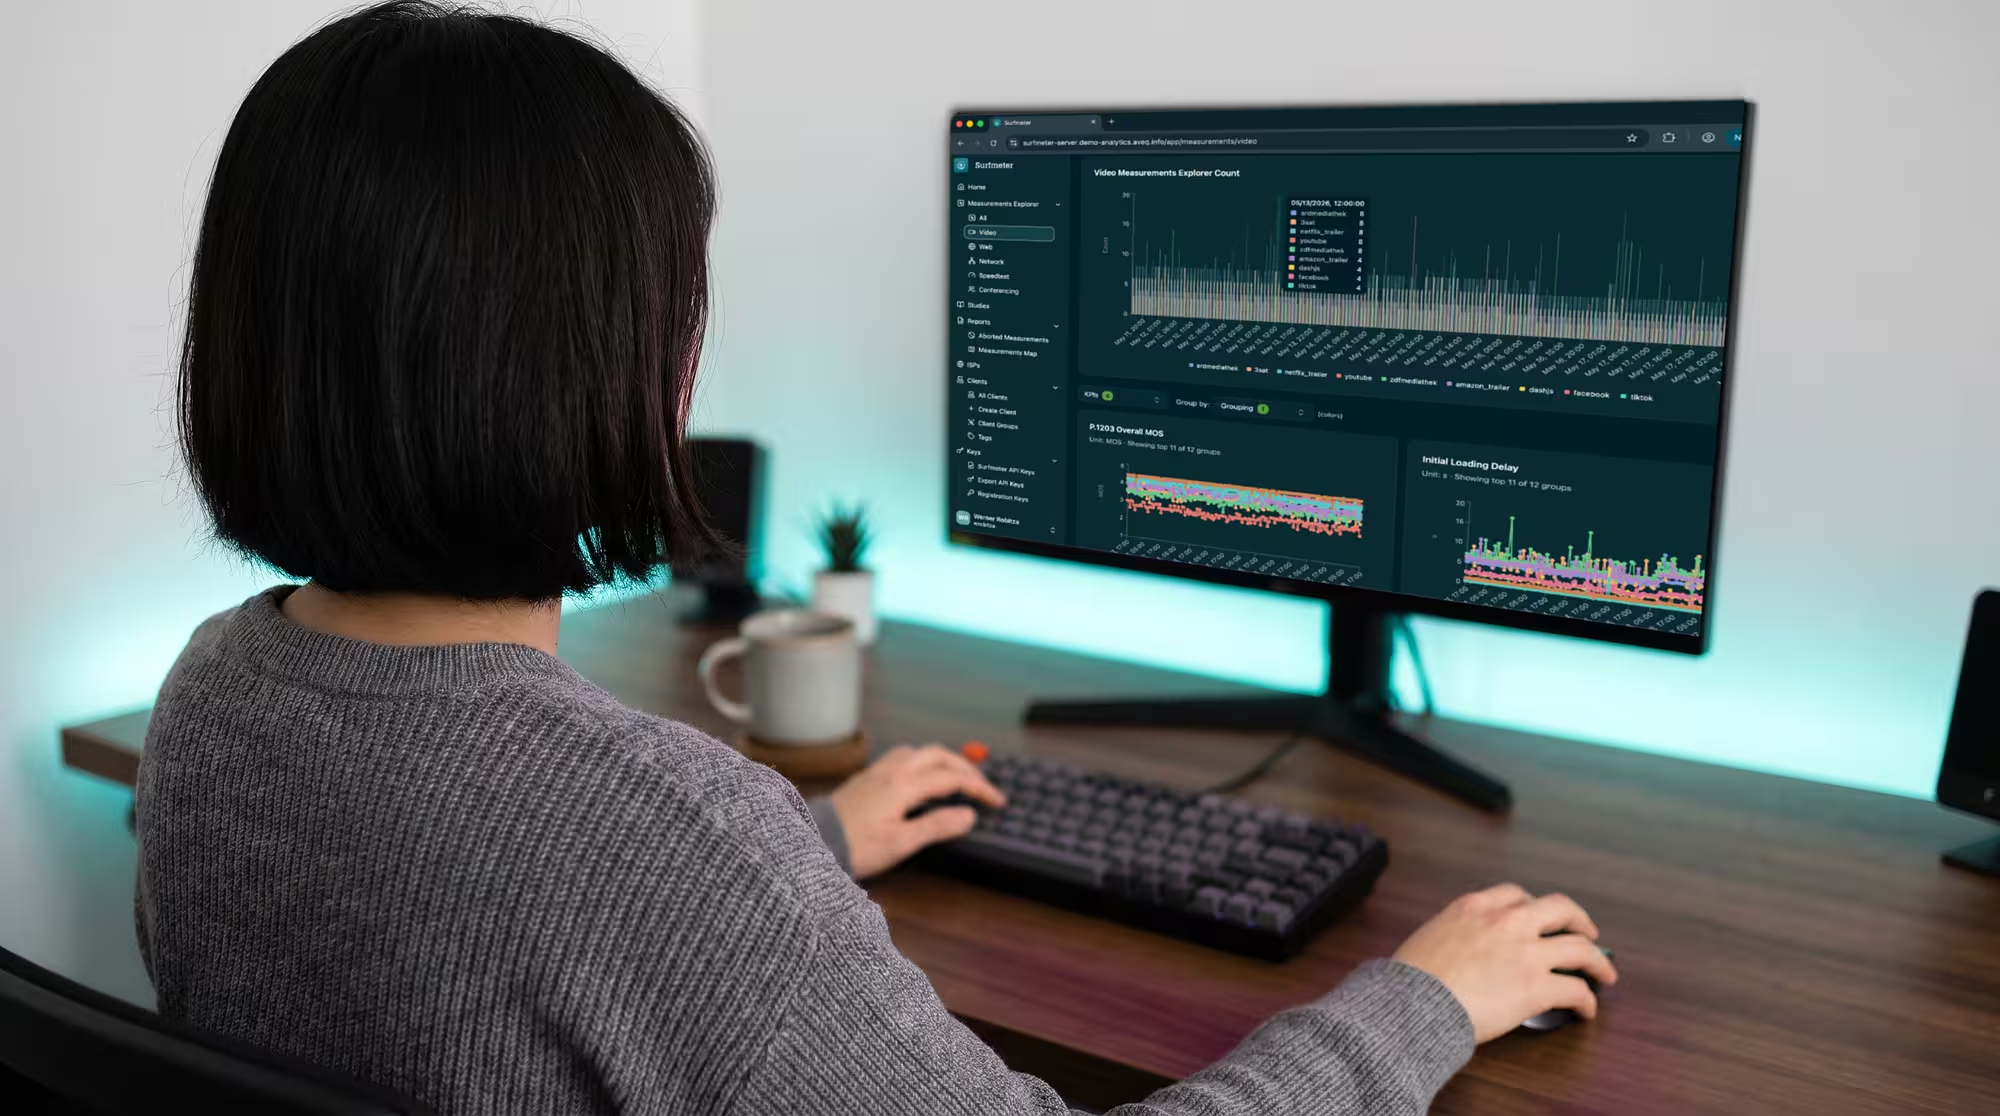
Real Video QoE Metrics
Go beyond resolution and Mbps. Measure loading delay, stalling, resolution adaptation, and ITU-T P.1203 MOS — a standardized score that predicts how users rate quality.
Move beyond network stats. See the true Quality of Experience your customers receive.
For ISPs, telcos, and connectivity providers who want to know QoE and QoS of their networks — in customers’ homes, at the exchange, and everywhere it matters. Deploy lightweight probes that measure what your subscribers actually experience.
The Challenge
Your network dashboards look green, but customers complain about stalling video and slow websites. Traditional monitoring tells you about link utilization and packet loss — but nothing about the quality your customers actually perceive. Complaints arrive too late, root causes stay hidden, and investments are based on guesswork rather than user experience data.
Our Approach
Probes running our Surfmeter application are deployed at key points in your network — from the core to customer-like locations. They actively and continuously test real-world services like Netflix, YouTube, and key websites, just as a customer would, giving you an end-to-end view of performance with ITU-standardized quality scores.

Key Capabilities
Go beyond resolution and Mbps. Measure loading delay, stalling, resolution adaptation, and ITU-T P.1203 MOS — a standardized score that predicts how users rate quality.
Correlate a bad QoE score with underlying network data — traceroute, latency, jitter, DNS — to find the bottleneck, faulty CDN, or degraded peering.
Objectively measure your network performance against competitors on the services that matter most to your users.
Monitor KPIs live and configure custom alerts. Get notified when quality degrades — before customers call support.
Proven in Practice
“We're using Surfmeter to gain unprecedented visibility into our network performance through automated, active measurements that simulate actual streaming video quality, exactly as end-users experience it”


Gcore, operating a global CDN with 210 points of presence across six continents, needed deeper insights into the interactions between streaming applications and their edge network. Traditional server-side monitoring couldn’t capture what end-users actually experience. With Surfmeter, Gcore gained real-world QoE visibility by measuring actual video streams from the same platforms and players that end-users rely on.
Results
Get a personalized demo and see how Surfmeter fits your use case. It only takes 30 minutes.
Business Benefits
How It Works
Surfmeter probes are lightweight software agents that run on standard hardware — Raspberry Pi, VMs, or dedicated appliances. No complex integration required.
Install Surfmeter on hardware probes, set-top boxes, or VMs at PoPs, exchanges, or customer-like locations across your network.
Schedule automated tests against OTT video services, websites, and network endpoints. Choose from a wide range of supported services or add custom targets.
KPIs including P.1203 Video MOS, Core Web Vitals, and speed metrics flow to the Surfmeter analytics platform in real time.
Monitor dashboards, set custom alerts, generate reports, and share data with your NOC, management, or regulatory bodies.
Data & KPIs
See how Surfmeter probing can transform your network quality monitoring. Get in touch for a demo or with your questions.
Thank you! We'll get back to you shortly.
Something went wrong. Please try again.