What Mean Opinion Score Means for Video
How the 1-5 score works, what shapes it, and why standardized video MOS matters.
Understand how video MOS is interpreted, what contributes to the score, and why validated models such as ITU-T P.1203 are useful for streaming quality measurement.
Turn technical measurements into a viewer-centric quality score
Mean Opinion Score, or MOS, expresses perceived quality on a simple scale from 1 to 5. In video streaming, the goal is to summarize how a user is likely to experience a session rather than just listing raw transport or player metrics.
That makes MOS useful as an operational metric. It helps teams compare services, markets, devices, and delivery paths using a score that is easier to interpret than bitrate, latency, or startup delay alone.
Range
How the MOS scale is usually interpreted
MOS is normally shown on a 1-5 scale. Exact thresholds vary by model and use case, but this broad interpretation is a practical starting point.
5
Excellent
Quality is perceived as very strong, with minimal visible or audible impairment.
4
Good
The experience is solid and acceptable for most viewers, even if minor issues exist.
3
Fair
Quality is usable but clearly compromised, often by loading delay, stalling, or compression effects.
2
Poor
Impairments are obvious and the session quality is likely to frustrate viewers.
1
Bad
The viewing experience is severely degraded and close to unusable.

Customer View
Want to know how your customers would rate your service?
This is where MOS becomes useful beyond engineering dashboards. A good video MOS helps you estimate how viewers are likely to judge the experience they actually had, without having to interrupt them and ask for a rating after every session.
That makes MOS closely related to customer satisfaction. It is not the whole story, but it gives teams a practical proxy for how service quality feels to real people, not just what the transport or player metrics looked like.
Composition
Video MOS is typically influenced by both media quality and playback behavior
Depending on the model, a video MOS can be influenced by delivered bitrate, codec efficiency, resolution, frame rate, loading delay, stalling events, and temporal effects over the course of playback.
For models such as ITU-T P.1203, the score is not based on a single measurement. It combines sub-models for visual quality, audio quality, and playback interruptions into an overall quality estimate for the session.
When people talk about a video MOS, they often mean a model that integrates several different quality dimensions rather than a single raw KPI.
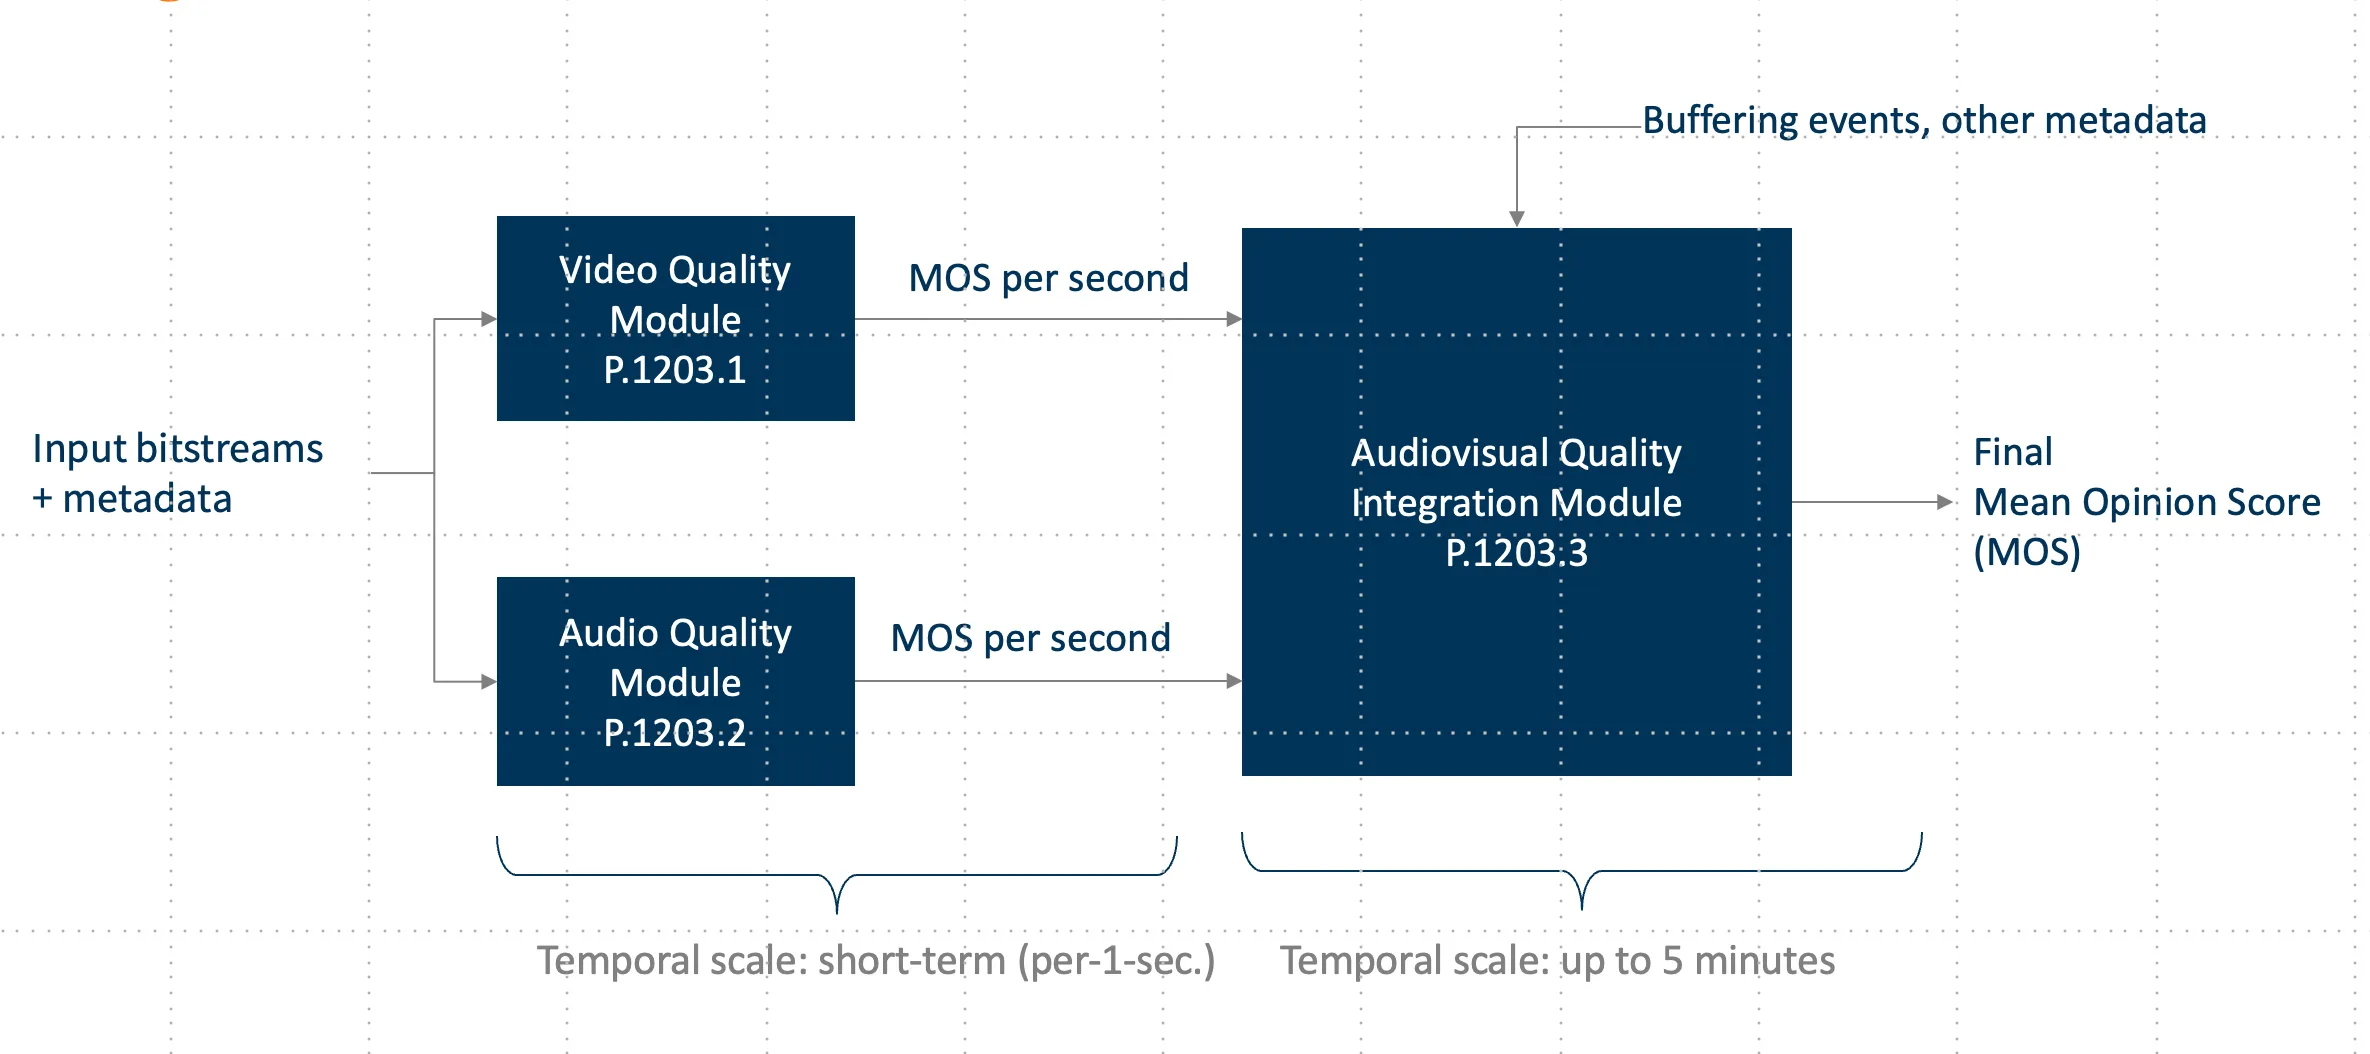
One standardized example is ITU-T P.1203, which combines video quality, audio quality, and playback-event context into a final MOS estimate.
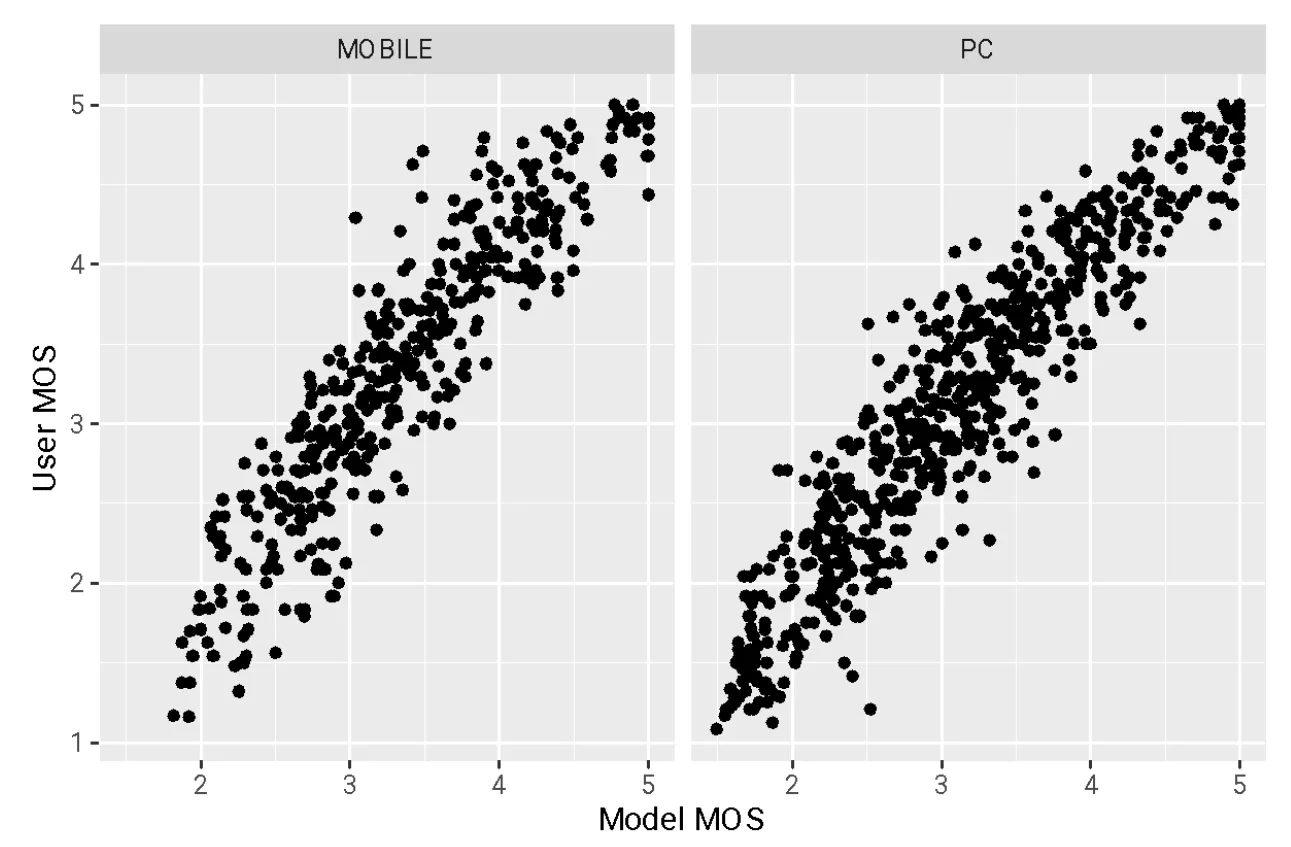
Model MOS versus user MOS ratings for the same video sessions on mobile and PC, illustrating how validated MOS models are compared against subjective viewer scores.
Validation
A trustworthy MOS model is validated against human ratings
The reason MOS is valuable is that it is tied back to subjective testing. Standardized models are calibrated and validated against panels of viewers who rate quality under controlled conditions, and then checked for how well the predicted score matches those human ratings for the same processed video sessions.
In other words, the model MOS is compared against the rating an actual user gave after watching the same content. For ITU-T P.1203, that comparison has been shown to perform very well against subjective data, which is why the score is useful as a practical proxy for perceived quality rather than just another technical metric.
That validation step is what separates an explanatory or standardized MOS from a purely proprietary score. It does not make the score perfect, but it does make it interpretable, comparable, and defensible in reporting and operations.
Limits
MOS is powerful, but it should not be the only number you look at
MOS is useful because it compresses complexity, but that also means it hides detail. Two sessions can end up with similar MOS values for very different reasons, such as loading delay on one side and repeated stalling on the other.
In practice, teams get the most value when MOS is paired with the underlying session metrics and context. That is how you move from a quality score to an actual root-cause analysis.
Data & KPIs
Typical inputs, sub-scores, and outputs around video MOS
Typical inputs
- Initial Loading DelayTime until video starts playing
- Stalling EventsNumber and duration of stalling
- Average Video BitrateAverage data rate of video stream
- ResolutionVideo output resolution
- Frame RateFrames rendered per second
- CodecVideo compression format
Sub-scores and composition
- Video Quality (Pv)Visual quality sub-score (1–5)
- Audio Quality (Pa)Audio quality sub-score (1–5)
- P.1203 Overall MOS (Pq)Combined audio-visual quality (1–5)
- Per-Segment ScoresQuality scores per video segment
How teams use it
- Video Session TimelinePlay, pause, and buffer events over time
- Resolution & Quality SwitchesHow often quality changes mid-stream
- Playback State TimelinePlay, pause, and buffer events over time
- Geolocation & ISPContext for comparing quality across networks and regions
Next steps
Further reading, documentation, and AVEQ solutions


Want to discuss how MOS fits your workflow?
We can help connect MOS, session metrics, and operational decisions across streaming, web, and network monitoring.
Thank you! We'll get back to you shortly.
Something went wrong. Please try again.