Gigabit broadband has become the new normal. In many countries we’re seeing gigabit availability rise, and, while it might still take a long time to get rid of copper, the deployment of fiber is an engineering success.
For a shorter introduction to this finding, read our earlier note on why bandwidth tells you nothing about video streaming performance.
But with that deployment come operational challenges: once an access line is fast enough, what still improves customer experience? In fact, we’d argue that the whole “value” of the product depends on whether people can feel the difference between their legacy connection and what an ISP wants to sell to them.
To answer the question of what ISPs can do to still win on Quality of Experience (QoE), we ran two studies:
- We studied three months of measurements from dozens of fixed-line probes deployed in the field. These probes used Surfmeter to collect various Key Performance Indicators and QoE scores, along with network-related information. The data covered more than 1.5 million web page loads, more than 1.1 million video sessions, and continuous network tests.
- We ran a dedicated Web QoE performance measurement campaign using an artificially shaped link, collecting tens of thousands of page loads across several weeks.
The most important finding: Above roughly 100 Mbit/s, more access capacity had no measurable effect on the streaming and web metrics we studied. The experience still changed, though, and we will explain why. In this article we will focus on the following important aspects:
- application KPIs under increased bandwidth
- latency under load
- the path beyond the access network
A speed test cannot directly explain any of that. Let’s dive in!
Changing the raw speed has almost no impact on application KPIs
We begin with the Surfmeter probe data that we collected from various links, spanning a range of 16 MBit/s DSL to Gigabit fiber. Due to some infrastructure changes, some of the lines we measured changed their provisioned rate during the measurement period. This gave us a useful before-and-after comparison. We could also compare each line with probes where the rate stayed the same — the control group.
Three changes could be isolated cleanly: one line access speed was essentially halved, another doubled, and a third went from 151 to 912 Mbit/s. However, despite those massive changes, live-site page load time and video startup stayed within six percent of the control group. Most other changes in terms of KPIs were even smaller.
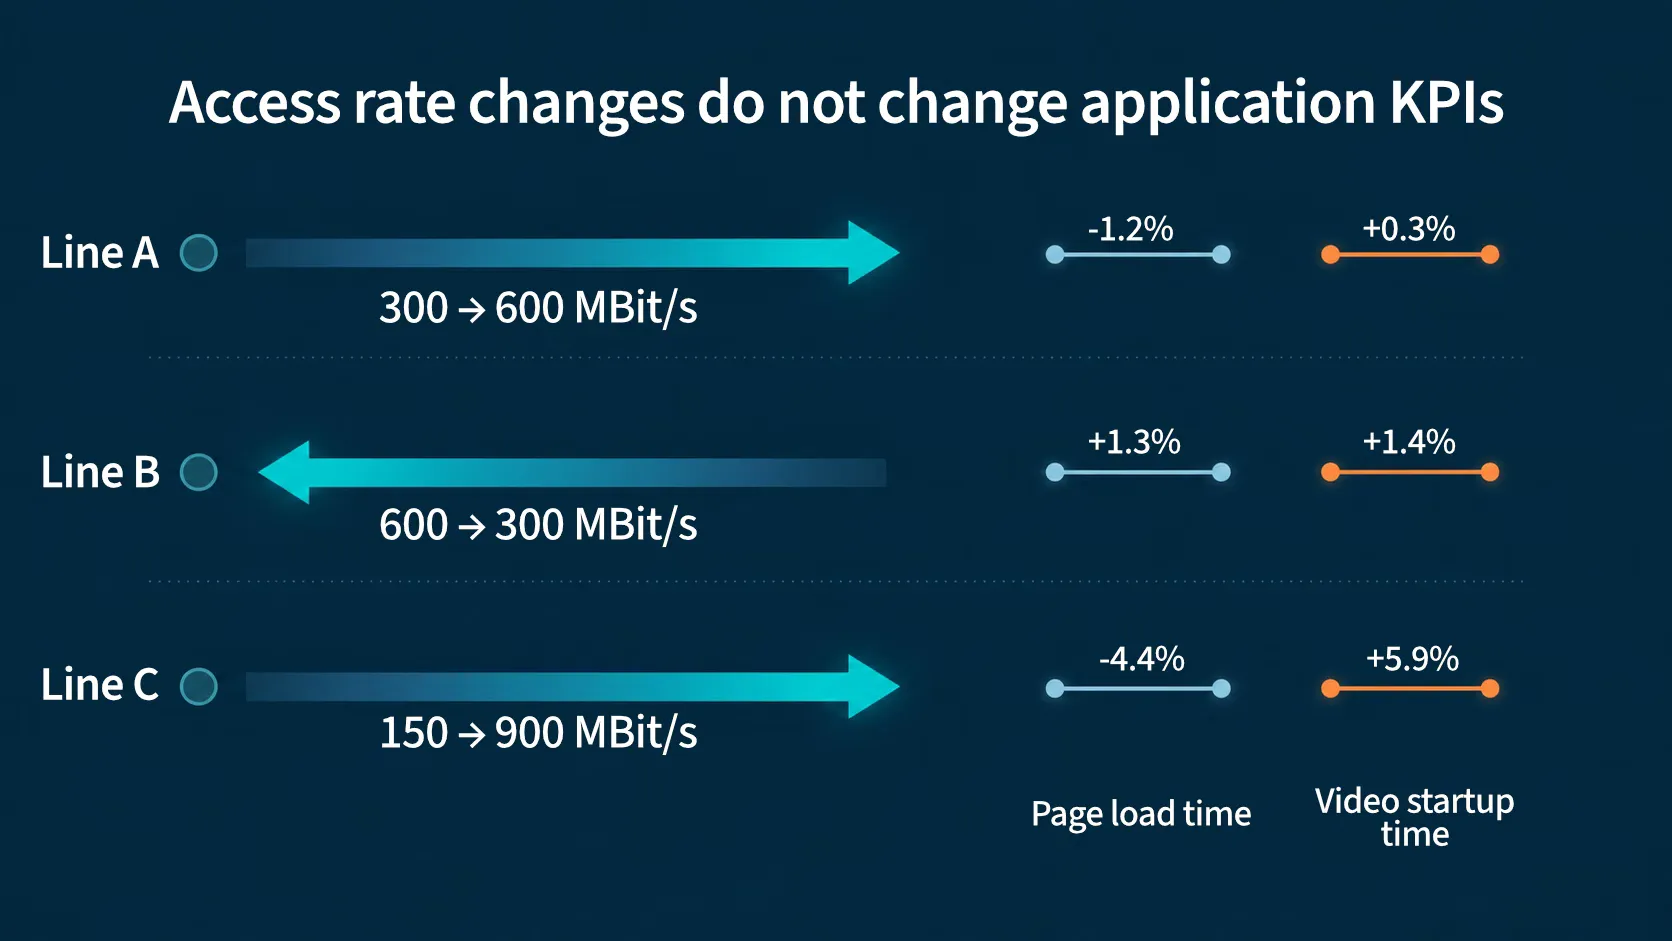
Changes in page load and video startup after an access-rate change, compared with lines whose rate stayed constant.
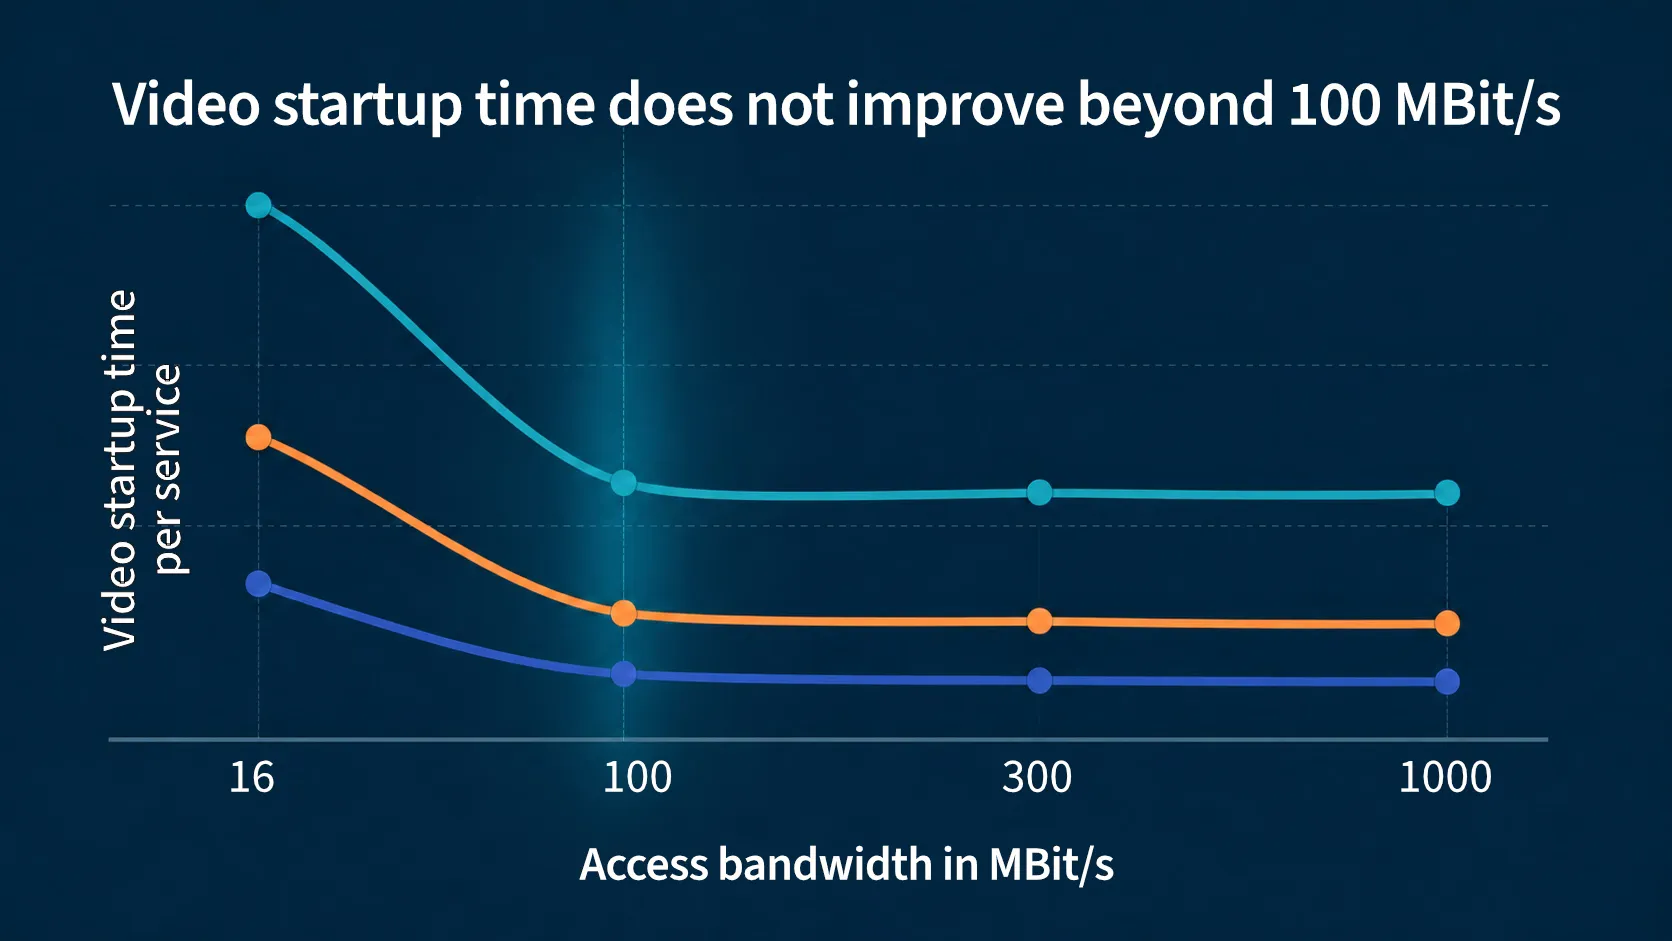
How much do we gain from more bandwidth? Let us look at the lowest tiers first: moving from 16 to 116 Mbit/s delivered at least 88% of the total improvement in video startup delay for 9 of the 13 video services we measured. Going beyond that, the higher tiers added little improvements.
This makes sense: the websites that host the videos are complex and pull in many resources from different domains. This includes JavaScript assets and static image files. Each of those domain connections requires a new setup. The overheads from making requests (including DNS lookup, TLS setup, TCP/HTTP connection) are larger than what a faster transmission time could buy.
Of course, there are caveats to these findings. Remember that quote? “640K (memory) ought to be enough for everyone” — it’s a fake quote anyway, but it feels relevant here. We don’t want to claim that you don’t need more than 100 MBit/s. Faster tiers still provide headroom for several users in one household. Your large downloads will be faster. You also often get much higher (symmetric) upload capacity, and future applications may indeed require more bandwidth. Fiber also brings benefits that an advertised speed does not describe, for instance in terms of general latency. But still, once a line has enough capacity for a video or web session, another few hundred megabits do little for that session.
Responsiveness is all about latency while the line is working
We are used to seeing ping results as an indication of latency. UDP pings can get through the network very quickly when there isn’t much traffic. But it is an incomplete latency measurement. Users load pages, join calls, and start streams while data is moving. Your kids might play games in the basement while you’re uploading that huge file to your company’s OneDrive. Our measurement scenarios must consider that.
To show you what that could mean, we ran a dedicated web QoE testing campaign. In that campaign we shaped the connection to simulate different kinds of access networks, and loaded various real websites. On a constrained profile, for instance, we measured the first connection of a page load, which completed its TCP handshake in 65 ms. Remember that TCP takes three handshakes, so latency was around 20 ms, give or take. However, new TCP connections opened moments later, while the same page was transferring data, already took 158 ms. In other words, one page load more than doubled the line’s own latency without any other user traffic.
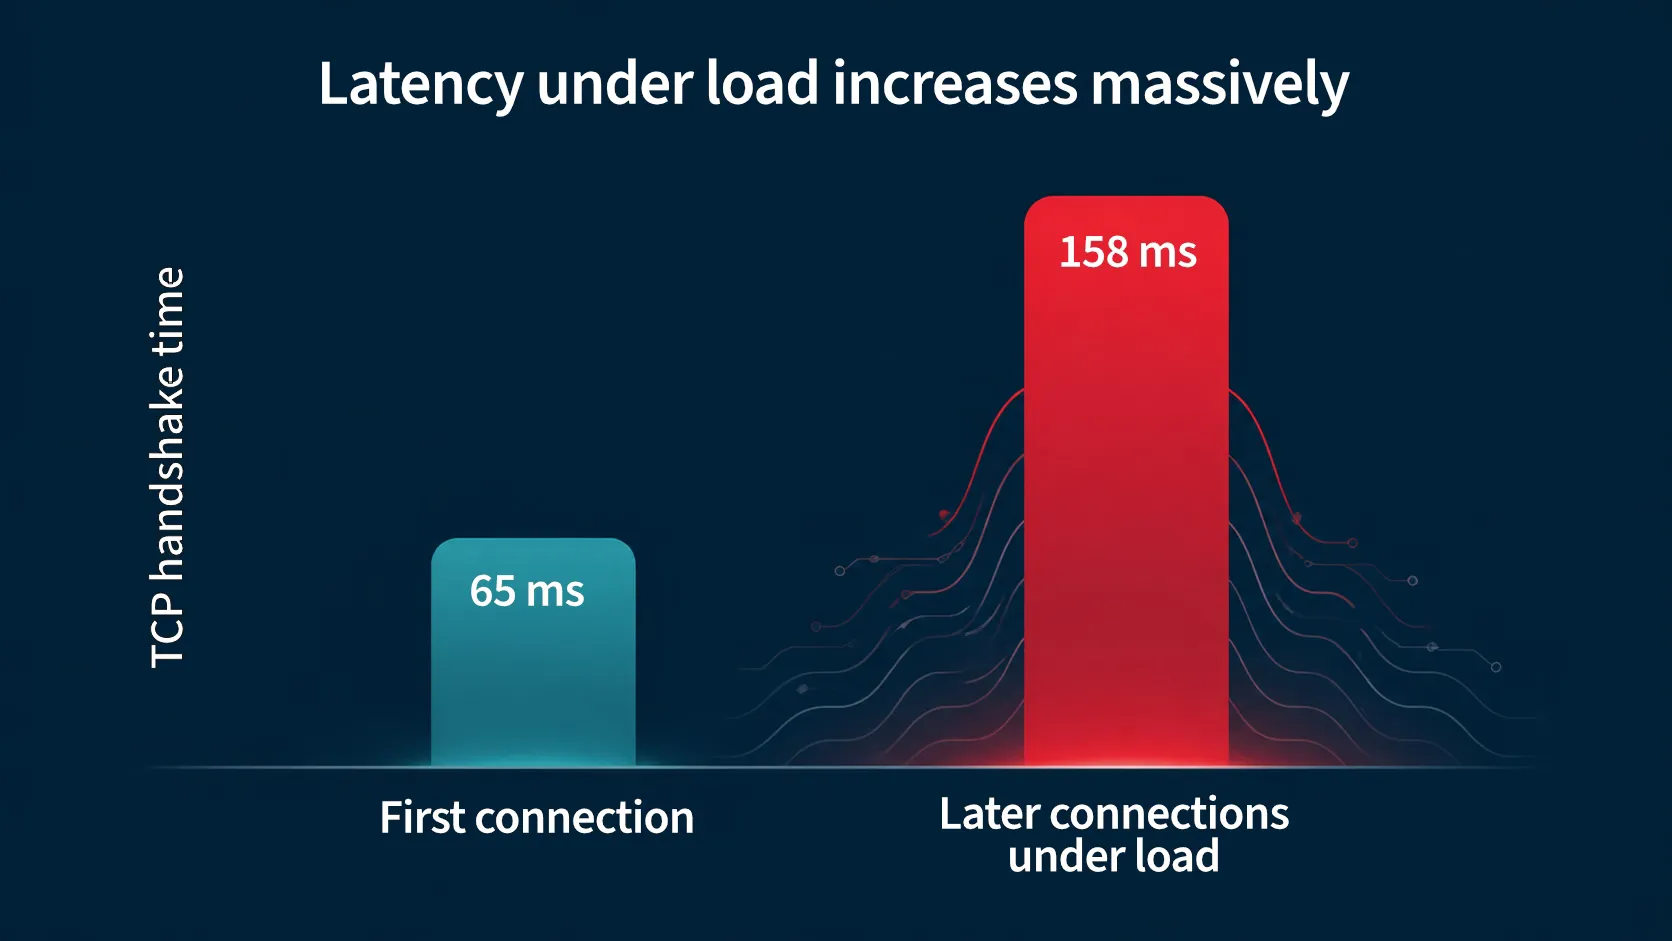
TCP handshake time before and during the same page load.
This is why working latency and responsiveness matter a lot for the final user experience. The IETF’s responsiveness measurement tests how usable a connection remains under load. It is a better network diagnostic than idle ping alone. However, it is still a…, well, network diagnostic. Your end users aren’t going to think in terms of packet responsiveness. It does not tell us what resolution a video reached, how long playback took to start, or whether it stalled, and it does not tell us how fast web pages feel to users. This is why you need application-level measurements — such as those provided by our Network QoS & QoE Probing solution.
Follow the request beyond the access network
Our focus in the industry tends to be in the access network, which is often where the bottlenecks lie — or used to lie. With multi-gigabit passive optical networks, the access is becoming less of a problem, at least in the fixed-network world. Let’s ignore bad Wi-Fi for a moment, and look upstream: where the data actually comes from.
In our fixed-line dataset, web page loads were 12.3% slower during the evening peak than between 02:00 and 06:00. Downstream rate, round-trip time, and DNS performance at the probes stayed effectively unchanged. This points to the delivery path beyond the access line, where origin servers, CDN edges, and peering affect each request.
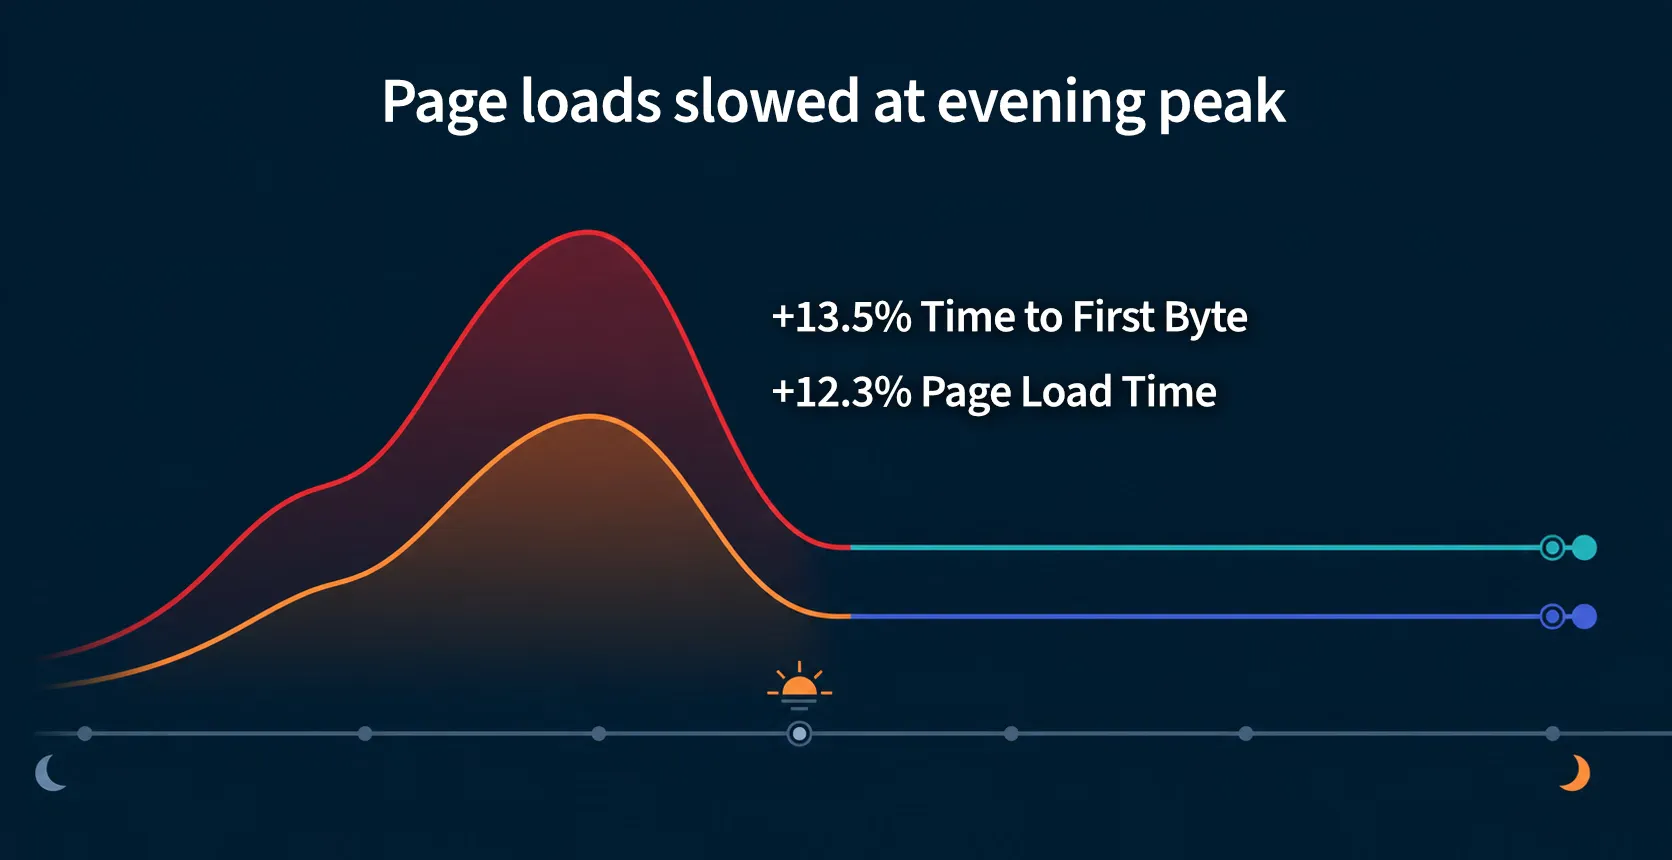
The evening slowdown was visible in application measurements, not in the access-line metrics.
A public case study we did together with CDN provider Gcore shows why this distinction matters. For a public broadcaster, the live stream delivered through Gcore stalled, even though the usual CDN metrics looked healthy (e.g., throughput, request errors). With our CDN Performance Analysis solution, Gcore could run direct video measurements from the end-users’ perspective. They used it to not only solve the stalling issues, but also verify the fix. Such measurements can therefore expose a peering imbalance, a manifest caching race, and player hiccups that users see as stalling.
The application itself matters too. It would be too simple to claim that “web browsing requires a bandwidth of X.” In our fixed-line study, the site being loaded explained 74% of page-load variation. In contrast, the actual access speed explained only 8.4%. For video, however, services often select the same bitrate and resolution across a wide range of access speeds. Our data shows that video services typically do not need more than 16 MBit/s (for HD content), and having 25 MBit/s available is plenty enough even for 4K streaming.
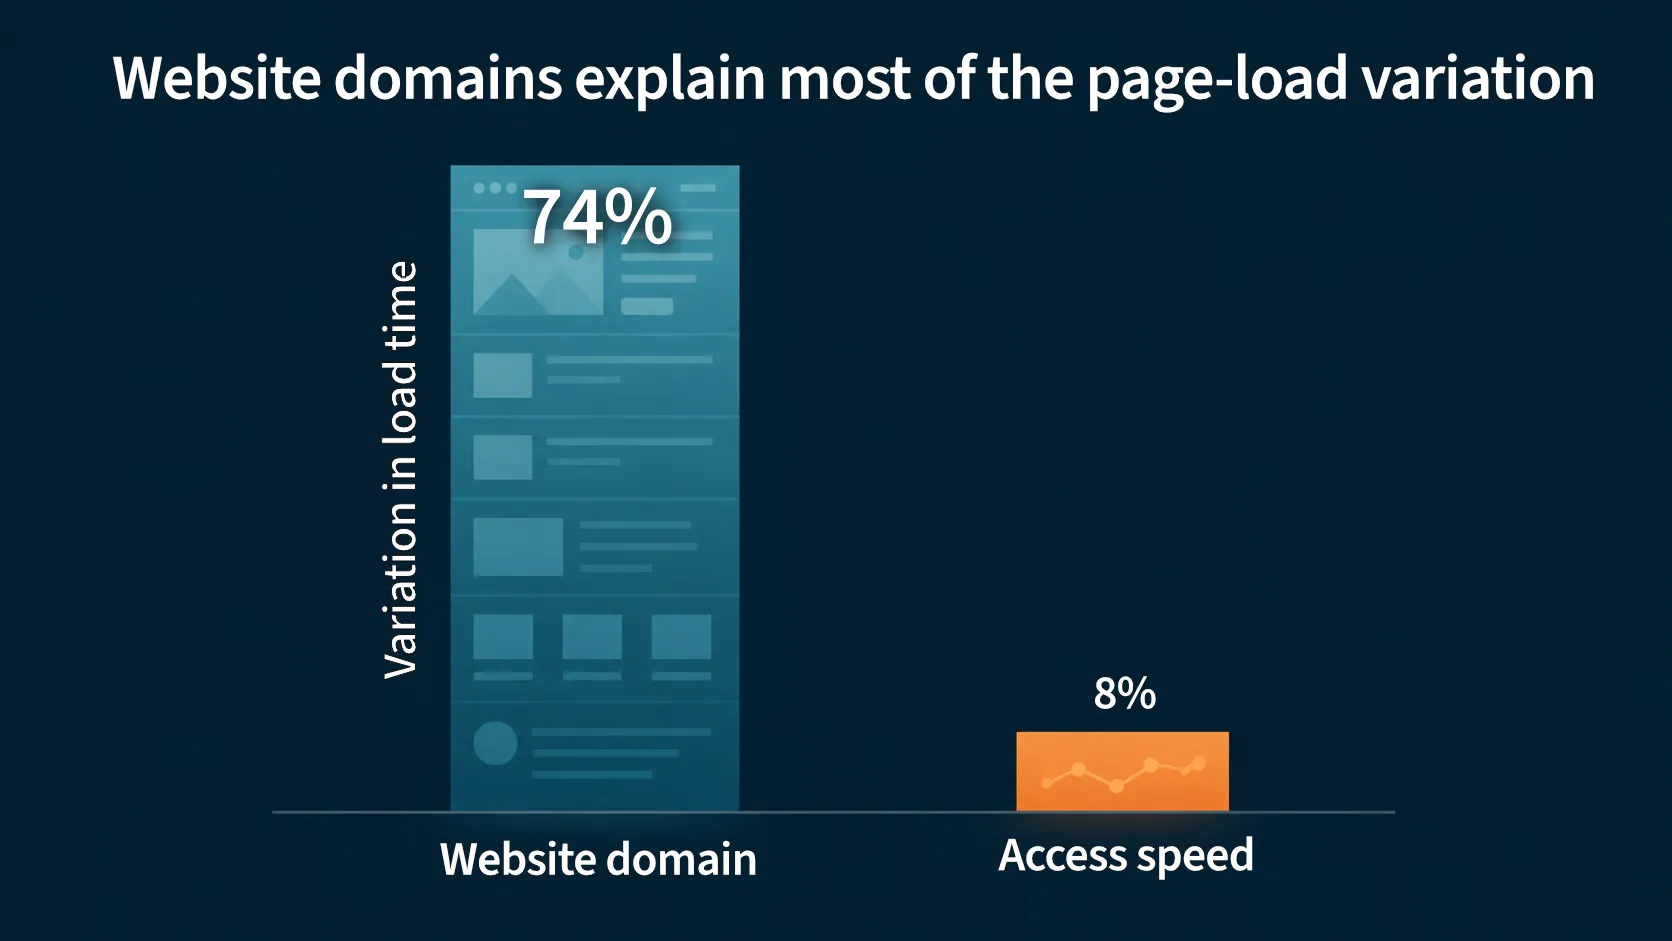
What the user opens often matters more than the provisioned access rate.
Of course, connectivity providers can do little about the upstream servers they peer with. But they can change the peering itself, and they can invest in better caching, so their end users get to the content faster In such scenarios, simple network testing with pings and speed test tells you only half of the picture. Operators need measurements from both sides of the chain, and from the application layer, to tell the difference.
Network quality and user experience are two different concepts
User experience is impacted by what’s happening on the screen. Users do not about bandwidth or packet latencies. They’ll notice a stream stalling, or a game becoming unplayable. In fact, my laptop feels noticeably slower when it’s on a Wi-Fi link than compared to being Ethernet-connected. Now, tell that to your average user running a 25 MBit/s VDSL line — how are you selling them a better experience?
It helps to keep three questions apart:
-
Quality of Service: What is the network doing? Measure throughput, latency, and loss. The line must provide what was sold.
-
“Network quality”: What does the network do under load? Measure working latency and responsiveness when there is demand. I put “quality” in scare quotes here because the network has no quality of its own; it’s rather performance. But the result on the user-experienced quality will be measurable.
-
Quality of Experience: What did the user receive? Measure application KPIs like video startup, stalling, bitrate, resolution, and adaptation.
For video, ITU-T Recommendations P.1203 and P.1204 combine application measurements into a trusted, internationally validated Mean Opinion Score. Our ITU-standardized Video MOS solution makes this scoring available as an integration for measurement platforms. The models were trained and tested against ratings from human viewers. Their inputs and methods are published, so results can be reproduced and audited. That validation matters, in our opinion. A proprietary score that predicts QoE only from network inputs may be useful, but it should not be presented as user experience unless its thresholds were tested against real people.
Unfortunately, there is no equivalent standardized model for web browsing yet. Web performance still depends on individual metrics and thresholds whose meaning changes with the device, access technology, and application. This remains an open measurement problem. In the interim, we have compiled a Web QoE score based on Google’s own recommended thresholds. It is currently in beta, and we are testing its usefulness across various deployment scenarios.
Put the measurement closer to the user
Many monitoring probes sit in labs, headends, or data centers. They cannot see the subscriber’s Wi-Fi, home wiring, or the queues in the CPE. Yet conditions in the home often affect the result, and the operator still receives the support call.
We began this article with the question of what it takes for the next generation of networks to be successful. We believe that the next useful step brings the measurement much closer to the subscriber. This lets an operator understand network performance and actual user experience, from the perspective where it matters. Also, with the right measurement approach, problems can be dissected into where they come from, whether it’s the access line, the home network, the delivery path, or the upstream application provider. Knowing about that split is more useful than offering another speed tier. It shows who can fix the problems that matter to users.
If you’re an operator interested in testing this approach on a real subscriber population, talk to us!