Streaming QoE
Everyone says their part is fine. The video still stalls.
Measure QoE from the viewer perspective and identify whether degradation starts in the CDN, the network, or the player.
AVEQ helps streaming teams close the last-mile blind spot with controlled probing, standards-based QoE scoring, and diagnostics that connect service degradation to its most likely cause.
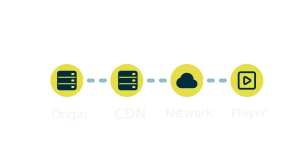
When the same measurement is taken from the viewer position, CDN delivery, network conditions, and player behavior can be assessed in one end-to-end view.
The Blind Spot
After the CDN, most monitoring stops where viewer experience begins
Origin and CDN systems can confirm that manifests and segments are available. They cannot confirm that a subscriber received a clean startup, stable playback, and consistent visual quality at home.
That gap becomes expensive when stalls appear, complaints rise, and every delivery partner can point to healthy upstream metrics. Without a controlled measurement from the viewer position, root cause analysis becomes slow, political, and often inconclusive.
How AVEQ Solves It
Measure streaming from the last mile, not just up to it
Controlled viewer perspective
Surfmeter probes load the page, start the player, and pull the stream like a viewer would, but from a controlled environment that removes household noise.
Deploy where the question is
Place probes near CDN edges, behind ISP routers, or at customer-like locations in the markets that matter. Expand coverage where recurring issues need closer visibility.
Diagnostics with context
Video QoE measurements run alongside DNS, HTTP, traceroute, speed, and web-loading tests, so a drop in quality can be tied to technical evidence immediately.
A Defensible Result
One score engineering and management can both trust
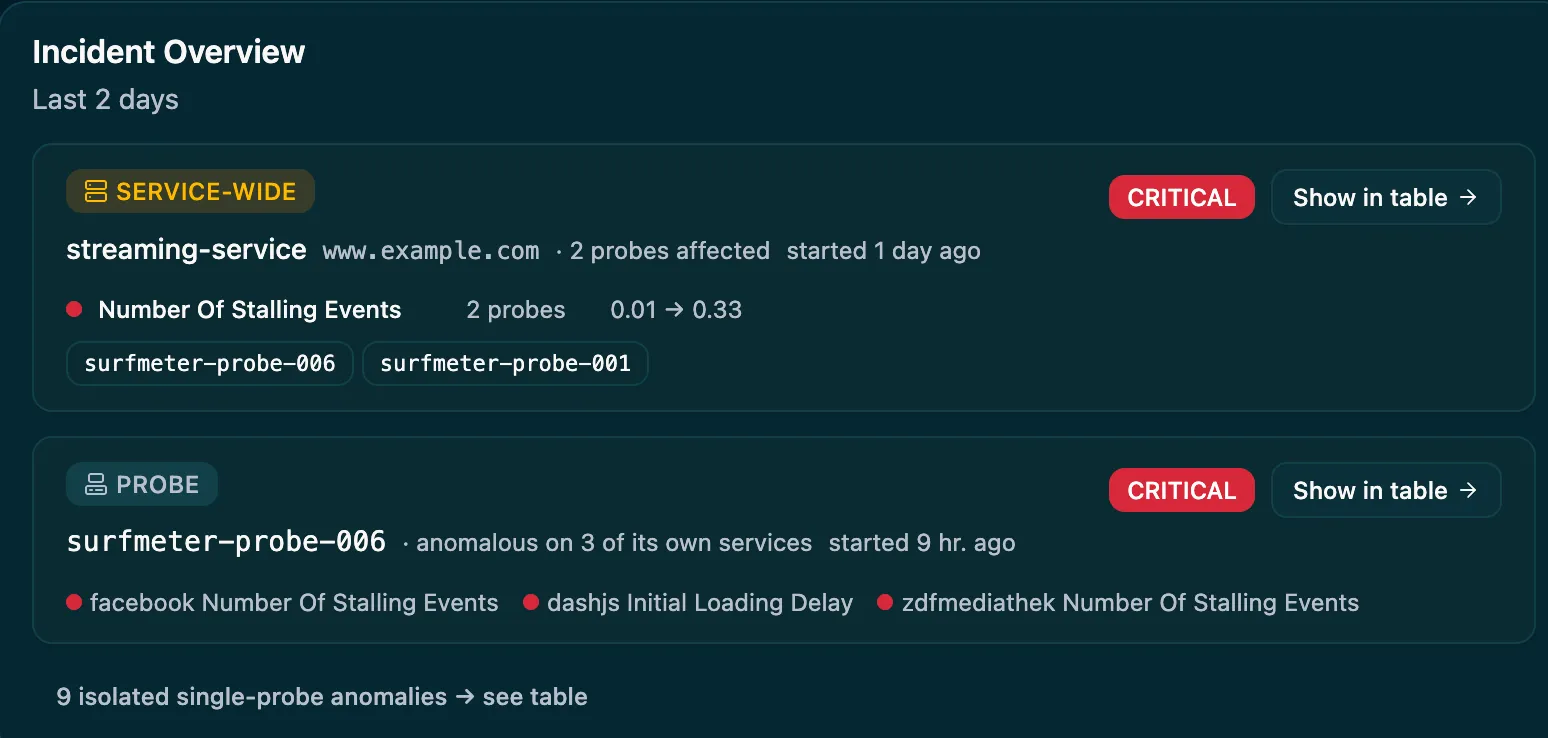
Surfmeter produces a session-level QoE score based on ITU-T Recommendation P.1203 . Startup delay, stalling, bitrate, resolution, and quality switching are folded into a single MOS on a scale from 1 to 5.
A standards-based score is easier to defend, compare, and operationalize than a private metric or a dashboard full of isolated KPIs. It gives engineering, operations, and management one shared view of whether the service was actually good.
Where It Helps
Use the last-mile view to settle delivery questions faster
CDN or cache issues
Compare the same stream across different CDN paths or regions and identify where stalling, slow startup, or reduced quality begins.
Last-mile and ISP questions
Test from access networks you do not control and verify whether degradation is linked to a specific region, ISP, route, or customer-like location.
Vendor blame cycles
Replace fragmented evidence with one controlled measurement and surrounding diagnostics that show whether the issue belongs to the stream, the CDN, the network, or the player.
Continuous quality monitoring
Run probes continuously or on demand and correlate QoE changes with network, web, and application-layer measurements as soon as they appear.
Explore Further
Continue into the AVEQ site
See the last-mile view on your own service
Talk to AVEQ about measuring streaming QoE where viewer experience is actually won or lost.
Thank you! We'll get back to you shortly.
Something went wrong. Please try again.