Having free WiFi on the train is great, except when it doesn’t work. While that means you get to look out the window and enjoy the breathtaking views, your work/your Netflix movie will stall.
We’ve come to learn that in the rail industry, traditional network KPIs (like signal strength, bandwidth, loss, jitter etc) often fail to reflect the actual passenger experience. So how can train operators understand the level of experience of their passengers? Since 2025, Oxyfi, a leading provider of managed train connectivity, has partnered with AVEQ to implement a robust Quality of Experience (QoE) measurement framework.
In 2024 Oxyfi installed a Starlink Satellite data link on a train in northern Sweden to complement their existing OxBox dual 5G robust high performance connectivity solution. As pioneers in multi-backhaul rail connectivity, Oxyfi integrated Starlink satellite links to operate alongside their robust OxBox multi-5G platform. To analyze the advanced hybrid network, Oxyfi needed a tool to evaluate how it translated into actual passenger value.
While evaluating the quality gains, they soon realized that they needed more than just the standard network parameters like signal strength, bandwidth, jitter, loss, round trip time etc to fairly assess the quality gains.
Connectivity on trains is a complex system with many different hardware and software components. It is not enough to measure a few components or aspects of a complex system to fairly assess its delivered quality. Instead the system as a whole should be tested, from the user perspective. Only by assessing the perceived quality of the services that passengers typically use onboard, i.e. surfing, Netflix, Youtube, Microsoft Teams and Google Meets etc, can a fair picture of the perceived quality be derived.
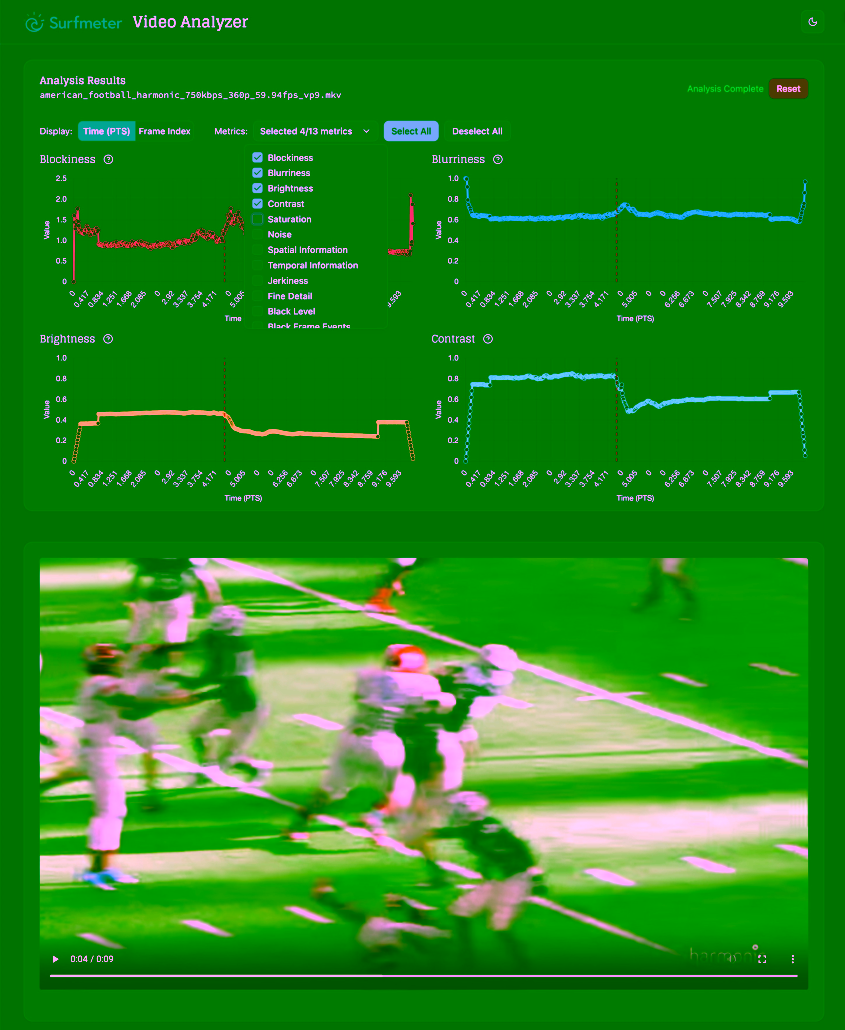
By deploying AVEQ’s Surfmeter technology, Oxyfi has moved beyond basic telemetry to understanding how services like YouTube, Netflix, and Microsoft Teams actually perform in the volatile environment of a moving train.
Read more