The P.1203 video quality metric for HTTP Adaptive Streaming

A highly accurate model for measuring the quality of streaming sessions — and an international standard

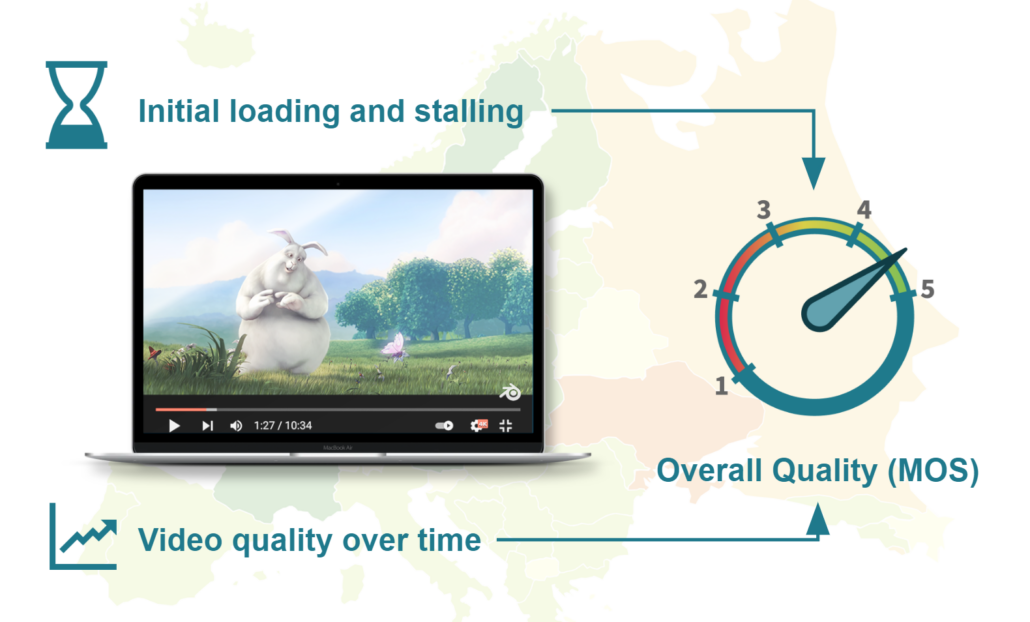
ITU-T Rec. P.1203 calculates the Quality of Experience of HTTP Adaptive Streaming sessions. It covers all degradations that may occur in a video stream caused by lossy compression, temporal or spatial downscaling, and stalling effects due to rebuffering events — including initial loading (startup time).

The standard predicts the QoE in terms of Mean Opinion Scores (MOS) on a scale from 1–5, where 1 refers to Bad quality, and 5 to Excellent.

The models have been trained and validated on over 1,000 audiovisual sequences that were rated by human viewers with over 25,000 individual ratings.

The models described in the standard have been created by an international consortium of academic and industrial partners.

Main components of video MOS

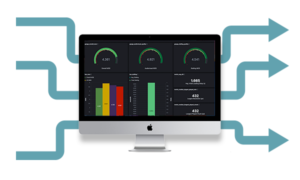
P.1203 takes complex inputs and delivers an easy to understand Video MOS.

Several modules for different aspects of the quality estimation

Do you want to know how well your network or your service performs?

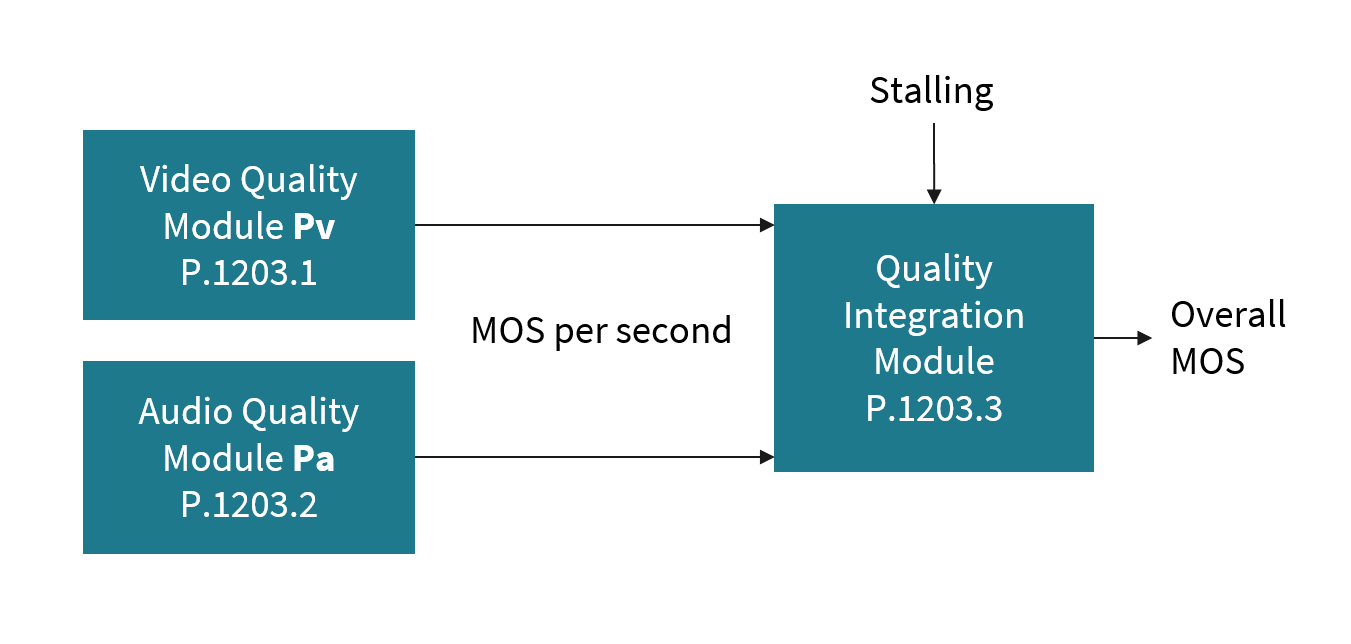
The input streams are analyzed separately for audio and video quality. The P.1203.1 and P.1203.2 Pv and Pa modules produce a per-one-second MOS value corresponding to the per-stream video and audio quality, which are then integrated over time — considering any influence by stalling and quality fluctuation happening during playout. The integration happens in the Pq module. It predicts a final MOS value.

This MOS value corresponds to the quality rating a user would have given had she/he seen the video.

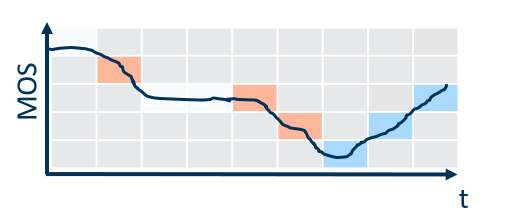
A unique feature of the model is the temporal integration done by the Quality Integration module (Pq), which takes into account effects like initial loading delay, stalling, and quality fluctuation over time. This accurately models subjects’ perception of an entire streaming session, especially in comparison to other video-quality only models (e.g., VMAF).

The modular structure allows the integration module to be used with other video/audio quality models, under the condition that the combination is validated in terms of prediction accuracy. For instance, video quality models from the ITU-T P.1204 family of standards can be used together with P.1203.

Modular approach (above) and temporal intergration (below)

You don’t have to check every pixel.

Bitstream-based metrics are less CPU-intensive than full-reference metrics.

Metadata & bitstream-based approach

Efficient and accurate — less data and computational resources needed.

The P.1203 standard is a distinct departure from conventional metrics like PSNR, SSIM, and VMAF. Unlike these full-reference metrics, which rely on source files and received files being available in decoded form, P.1203 takes a metadata and bitstream-based approach, analyzing the stream metadata (codec, bitrate, resolution, …), frame types and sizes, or the encoded bitstream file — without the need for decoding or referencing the original source.

This has huge benefits in terms of required computational resources and data storage. Also, DRM is not an issue for the model when operated in the metadata- or frame-based mode.

  • Reduced processing time makes P.1203 versatile

  • Easy deployed throughout the stream delivery ecosystem

  • Maintains very high prediction accuracy

Four modes of operation for differnt levels of data

Four modes based on the level of information

Adjust to the computational resources at hand.

P.1203’s simplest mode of operation (mode 0) takes as input: audio/video bitrate, video resolution, frames per second, and stalling events happening at the client side. Depending on the available data, it offers higher modes of operation that increase prediction accuracy at the expense of being (somewhat) more computationally intensive and requiring input data from more in-depth bitstream inspection.

While Mode 0 has access to basic data, Mode 1 can inspect the packet headers of the transmitted stream to obtain frame sizes and types. This works with DRM-protected content and is a great choice for client-side evaluation where bitstreams cannot be read directly (e.g., due to encryption).

Modes 2 and 3 have access to the bitstream itself, where mode 2 only accesses 2% of the stream to reduce computing efforts. Mode 2 is rarely used in practice, since Mode 3 can be calculated rather efficiently using modern hardware.

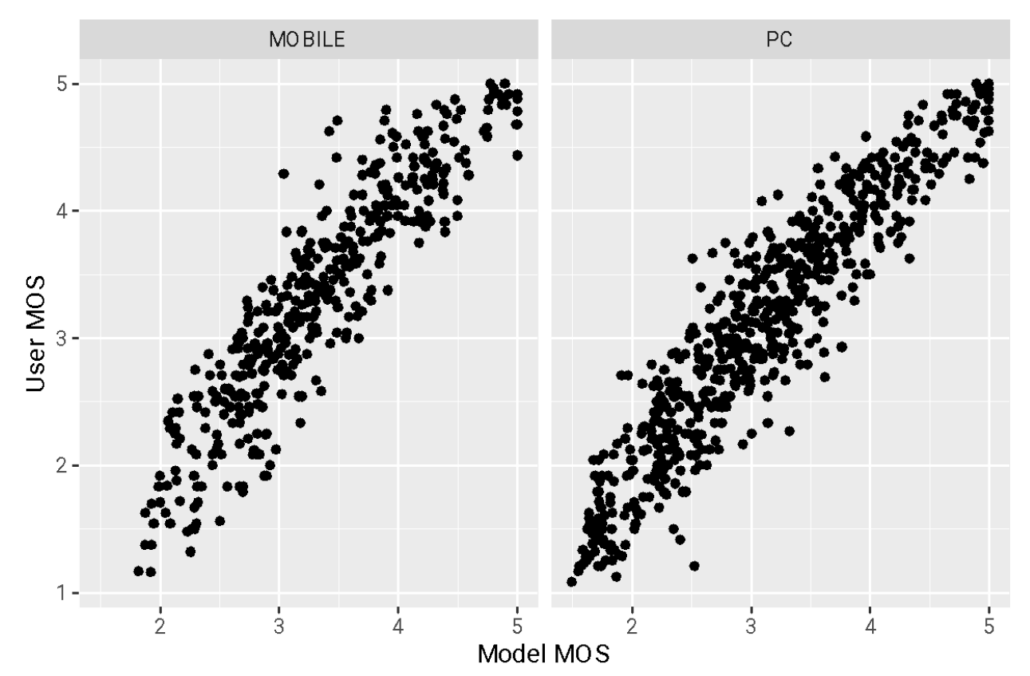
MOS model to real MOS correlation using P.1203

The ITU-T Rec. P.1203 model offers excellent performance when compared against subjective data. With a correlation of up to 0.9, real users’ ratings can be predicted with great accuracy.

Source: Robitza et al., MMSys 2018

Highly accurate Quality of Experience predictions

Validated with more than 1,000 video sequences and 25,000 individual ratings.

The MOS reflects the overall experience of the user. It includes effects of initial loading, stalling, and quality variations throughout the video. This is the primary value of concern when assessing the streaming quality.

The value range can be interpreted as follows:

1: Poor
2: Bad
3: Fair
4: Good
5: Excellent

In practice, a perfect score of 5 cannot be reached, since even humans cannot always agree that a video sequence is Excellent. This means that the highest possible score will be around 4.7. Any value above 4 is therefore considered very good.

A value between 3 and 4 indicates issues with the streaming performance. A value below 3 indicates severe problems with the streaming performance. Of course, this is still dependent on the actual setup and there is never an “absolute” MOS.

The MOS output of the ITU-T model corresponds very closely to the user ratings, with a correlation of about 0.85 to 0.9. This is highly accurate, especially considering the multitude of factors that may influence a final rating.

How MOS measurements can help you

There are many reasons our customers rely on our monitoring solutions.

  • Easily compare your offerings:

    A single number makes it possible to know where you stand against competitors.

  • Identify problematic areas:

    With the MOS, it is easy to detect regions or times of bad service quality, without having to rely on complex technical indicators.

  • Dig deeper:

    Use the underlying diagnostic KPIs to perform a root cause analysis and improve your service.

  • Focus on the user experience:

    Identify customer experience and customer satisfaction issues. And solve them — for happy customers.

Want to take your video quality monitoring a step further?

The products that power the QoS and QoE monitoring solutions.

Surfmeter Lab

Our core technology to drive video and web tests. Any service that runs in a browser — we can measure it.

Read more.

Surfmeter Automator

Automated measurements – at scale. A powerful automation framework for running Surfmeter measurements on a schedule.

Read more.

Surfmeter Dashboard

More than just data – our streaming analytics dashboard combines all Surfmeter measurement results.

Read more.

Contact Us

Let us know your questions regarding video MOS, what models perform best and how to integrate MOS calculation into your streaming setup.

We will find the solution that works best for you.

You have not accepted the necessary cookies to enable reCAPTCHA. Please send an email to hello@aveq.info, or click the following button to enable cookies:

Capabilities and Supported Technologies

We constantly implement new data sources and visualisation options.

Measurements for video, web and network

Common OTT platforms (see below)
ExoPlayer (HLS and DASH)
DASH.js, hls.js
Web Browsing KPIs (W3C Navigation Timing API)
Speed tests (download, upload, latency)
Network measurements (ICMP ping, DNS, …)

Selected services we support

YouTube
Amazon Prime
Netflix
ARD/ZDF Mediathek
Zattoo
Joyn
… and many more (just ask!)

Dashboard Features

Fully customizable visualizations
Combine filters and graphs in dashboards
User and permissions management
Delegate access to stakeholders

Live data feeds, 24/7
API for import and export of data

Cloud-based service: access directly through your browser
Fully compatible with mobile devices

Integrations and deployment

Add context data from your sources
Ingest additional measurements via API
Perform regular exports for further analysis

On-premise or hosted by us
Fully GDPR-compliant hosting
Secure German datacenter