Gigabit and, in some places, multi-gigabit access has become ordinary. On most fixed-line networks a speed test now reports hundreds of megabits per second, often more, and for years that headline number was a fair proxy for “good internet”. In fact, many benchmarking results still put that number on the top of their results. We believe that era is ending. The speed test number doesn’t tell you what a subscriber actually experiences when they press play on a video.
Video streaming today is dominated by large OTT services like Netflix, YouTube, Disney+, and Prime Video, delivered over networks that nobody owns end to end. If you are an ISP, mobile operator, benchmarking provider, regulator, or drive test vendor, you share the same job: figuring out how well those services actually work for your users, across different access networks, locations, devices, and times of day.
Choosing a video quality measurement solution for that job means looking hard at both the model itself and the delivery architecture it assumes. At AVEQ, our Surfmeter Mobile SDK is built on ITU-T Rec. P.1204.1, the most recent video quality standard from ITU-T, and we believe it is the only solution that fits the modern OTT reality. This article compares P.1204.1 directly with another model commonly cited for the job, PEVQ-S from OPTICOM, to help you navigate the current market.
TL;DR: The minimum detectable stalling duration in video streaming is between approximately 80 and 200 milliseconds, for most viewers.
One of our customers recently asked about some possible video measurement artifacts: streams that ran into a lot of minor stalling events. That is, video rebuffering shortly, as indicated by the HTML5 video player’s event timeline. Their question was: do users notice these stallings at all? In particular when they’re as short as 100 ms, or less? Initially, we couldn’t provide an immediate answer, but we settled on a default filter to eliminate stallings of <100 ms from our statistics.
We wanted to go deeper and understand what really happens on a psychophysical level — do viewers even notice 100 ms of stalling? Are they more sensitive than that? Or does it really not matter?
To find out, we searched for academic studies, and we found some interesting results. Read on to discover what we learned about stalling detection thresholds, and the importance of knowing the context (content motion, scene context, and viewer attention) to decide whether to consider them or not.
AT&T recently published a paper on AMVOTS, their Automated Mobile Video Objective Testing System, built in collaboration with Ericsson. It is a lab-based platform for measuring video quality on mobile devices under realistic network conditions. For anyone working in video QoE — ourselves included — it is worth a closer look. We talked with Ericsson researcher David Lindero, who explained to us the background of their joint work. Read on to learn more!
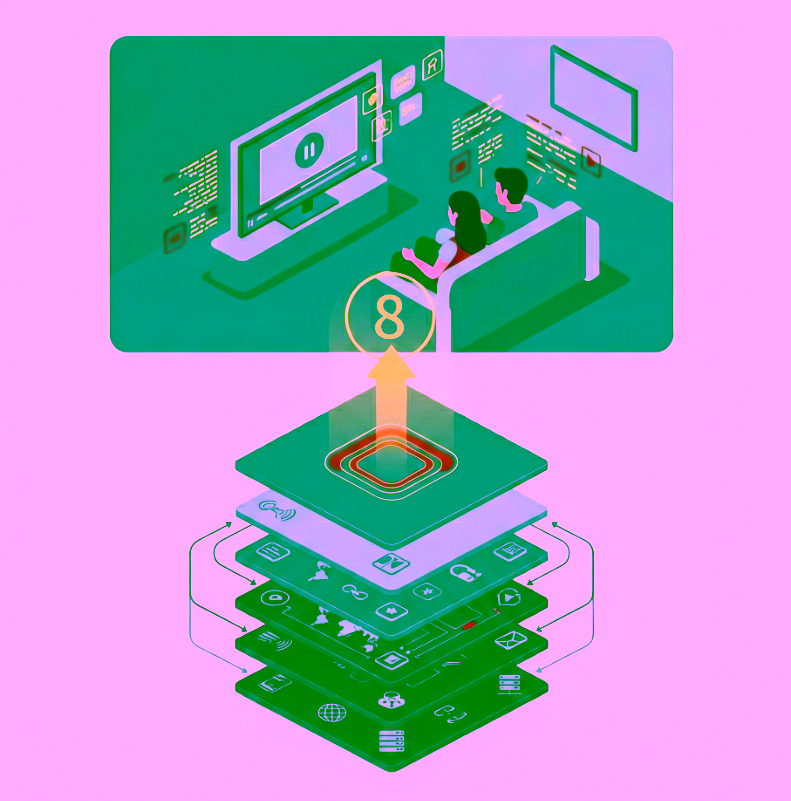
The ISO/OSI model is the invisible backbone of our daily internet use. It’s an abstract framework that organizes the complex process of digital communication into seven distinct layers: Physical, Data Link, Network, Transport, Session, Presentation, and Application. However, the complexity of this stack leads to two important issues when it comes to measuring end-user experience:
Many network measurement tools focus on metrics from a single layer, providing only a partial view – measuring or optimizing one layer in isolation doesn’t guarantee a better overall user experience. In other words: problems experienced by users often stem from complex interactions between these layers.
The highest ISO/OSI layer still does not tell you what the user really experienced. While it gives you important information about what was transmitted on the network, knowing what happened on the screen is the most crucial aspect for the final Quality of Experience.
At AVEQ, our Surfmeter platform is built on a cross-layer measurement methodology. This means Surfmeter doesn’t just look at one piece of the puzzle; it analyzes how the different layers work together to deliver services to your end-users
And while over the course of time some layers have become less important, there is something new on the horizon: Layer 8 – the end-user layer. This is where the actual customer experience happens. In the current research discussions, Layer 8 is becoming increasingly talked about, even though there is no standardized definition of that yet.
Stakeholders across the entertainment and networking industries realize that this holistic approach is crucial for truly understanding and improving Quality of Experience (QoE). Let’s explore this top-most layer in conjunction with the ISO/OSI layers to see why this matters.
We’re pleased to share new research that has been published in IEEE Access. The findings validate the accuracy of QoE prediction models such as ITU-T Rec. P.1203 against real-world streaming conditions. The peer-reviewed paper, titled “Satellite Streaming Video QoE Prediction: A Real-World Subjective Database and Network-Level Prediction Models,” represents a collaboration between researchers at the University of Texas at Austin (LIVE), Viasat Inc., TU Ilmenau (Audiovisual Technology Group), and AVEQ. As the title indicates, it tackles the challenge of predicting video Quality of Experience (QoE) over satellite networks using real user data.
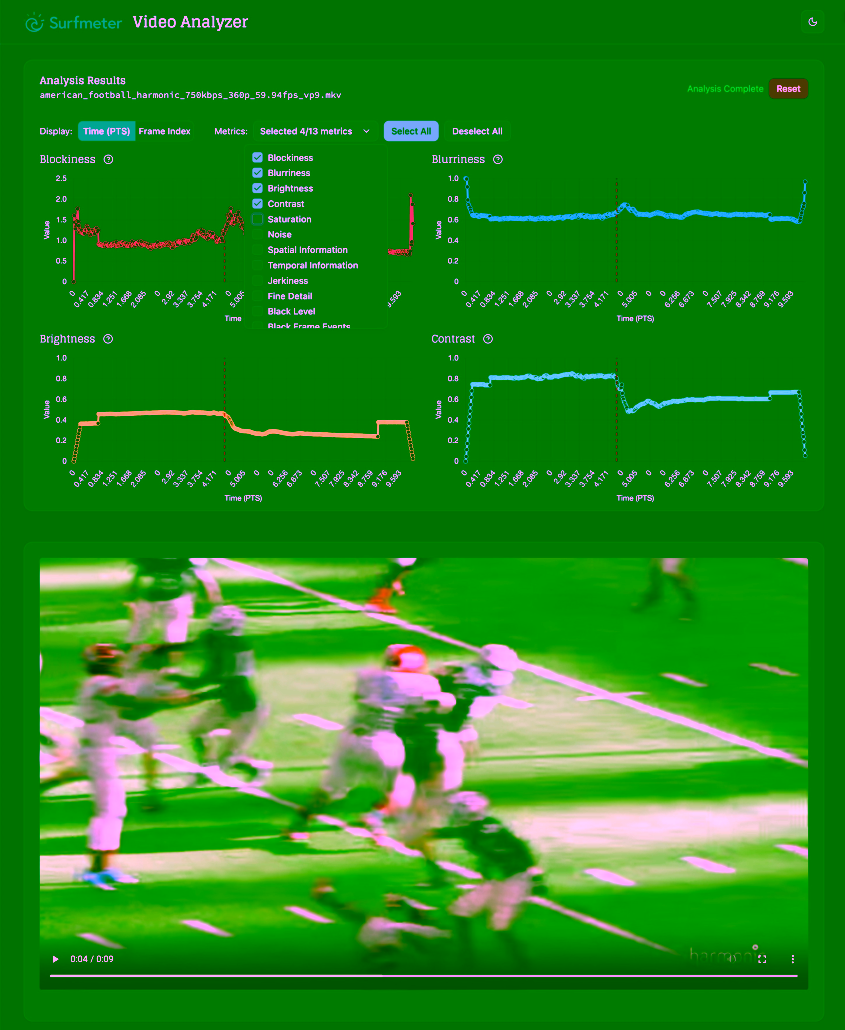
At AVEQ, a significant part of our work involves the deep analysis of video streams to understand and quantify quality. While our flagship product Surfmeter uses a client-side approach to measure delivery QoE (i.e., how well does the network support streaming?), we also needed a solution to understand video quality at the source. Think, for example, ingesting video streams that might be affected by blockiness or frozen frames. Or verifying encoder output. To address this, we built the AVEQ VideoAnalyzer — and in this post we’re going to give you a sneak preview of it.
Are you providing Internet services, and your customers complain about buffering screens and broken movie nights? Are you perhaps telling them that the problem might be their local WiFi, because in your own network monitoring tools, ping tests show that the video CDN was available within a few milliseconds? Of course, ping tests are, and will remain, an essential tool for basic network diagnostics. But when your customers complain about buffering, broken conferences, etc., are they still the only tool you should be reaching for? In this post, we’ll explain how modern application-layer monitoring is the key to enable a great QoE to your customers. Read on to find out more!
Networks can behave like humans: Sometimes they have a shiny great day and everything works like a charm – and sometimes they feel tired and are soooo slow. Usually when humans get tired, they need a rest from the hard work they did. Networks don’t have that luxury. Under stress, they greet us with loading spinners, rotating hourglasses or just a simple “the service you are calling is not available” message in the browser. How can you, as a network operator, make the right decisions and make networks more resilient against packet loss or jitter, inefficient routing and transmission delays. And how do you pre-emptively solve customer complaints? The answer is: continuous quality monitoring. For video, web browsing, or other OTT apps like conferencing services.
But all the best data is not useful if you can’t make sense of the numbers you’re seeing. So in this article, we want to go deeper and explain how you can understand the data from the monitoring itself. In particular, the Mean Opinion Score.
Our website, like many others, stores and retrieves information on your browser using cookies. This information is used to make the site work as you expect it to. It is not personally identifiable to you, but it can be used to give you a more personalised web experience.
Other cookies may be necessary to enable custom functionality. In such cases, information about you may be shared with third parties. You can modify our use of cookies in these settings.
Necessary Cookies
These cookies are strictly necessary to provide you with services available through our website and to use some of its features.
Google Tag Manager, Google Analytics, LinkedIn Insight
This website uses Google Tag Manager. Google Tag Manager enables us as marketers to manage website tags via an interface. Google Tag Manager takes care of triggering other tags which in turn may collect data.
You can disable Google Tag Manager here:
Google reCAPTCHA
This website uses Google reCAPTCHA to prevent spam in contact forms.
You can disable Google reCAPTCHA here:
Privacy Policy
You can find more details on our use of external services and cookies in our privacy policy