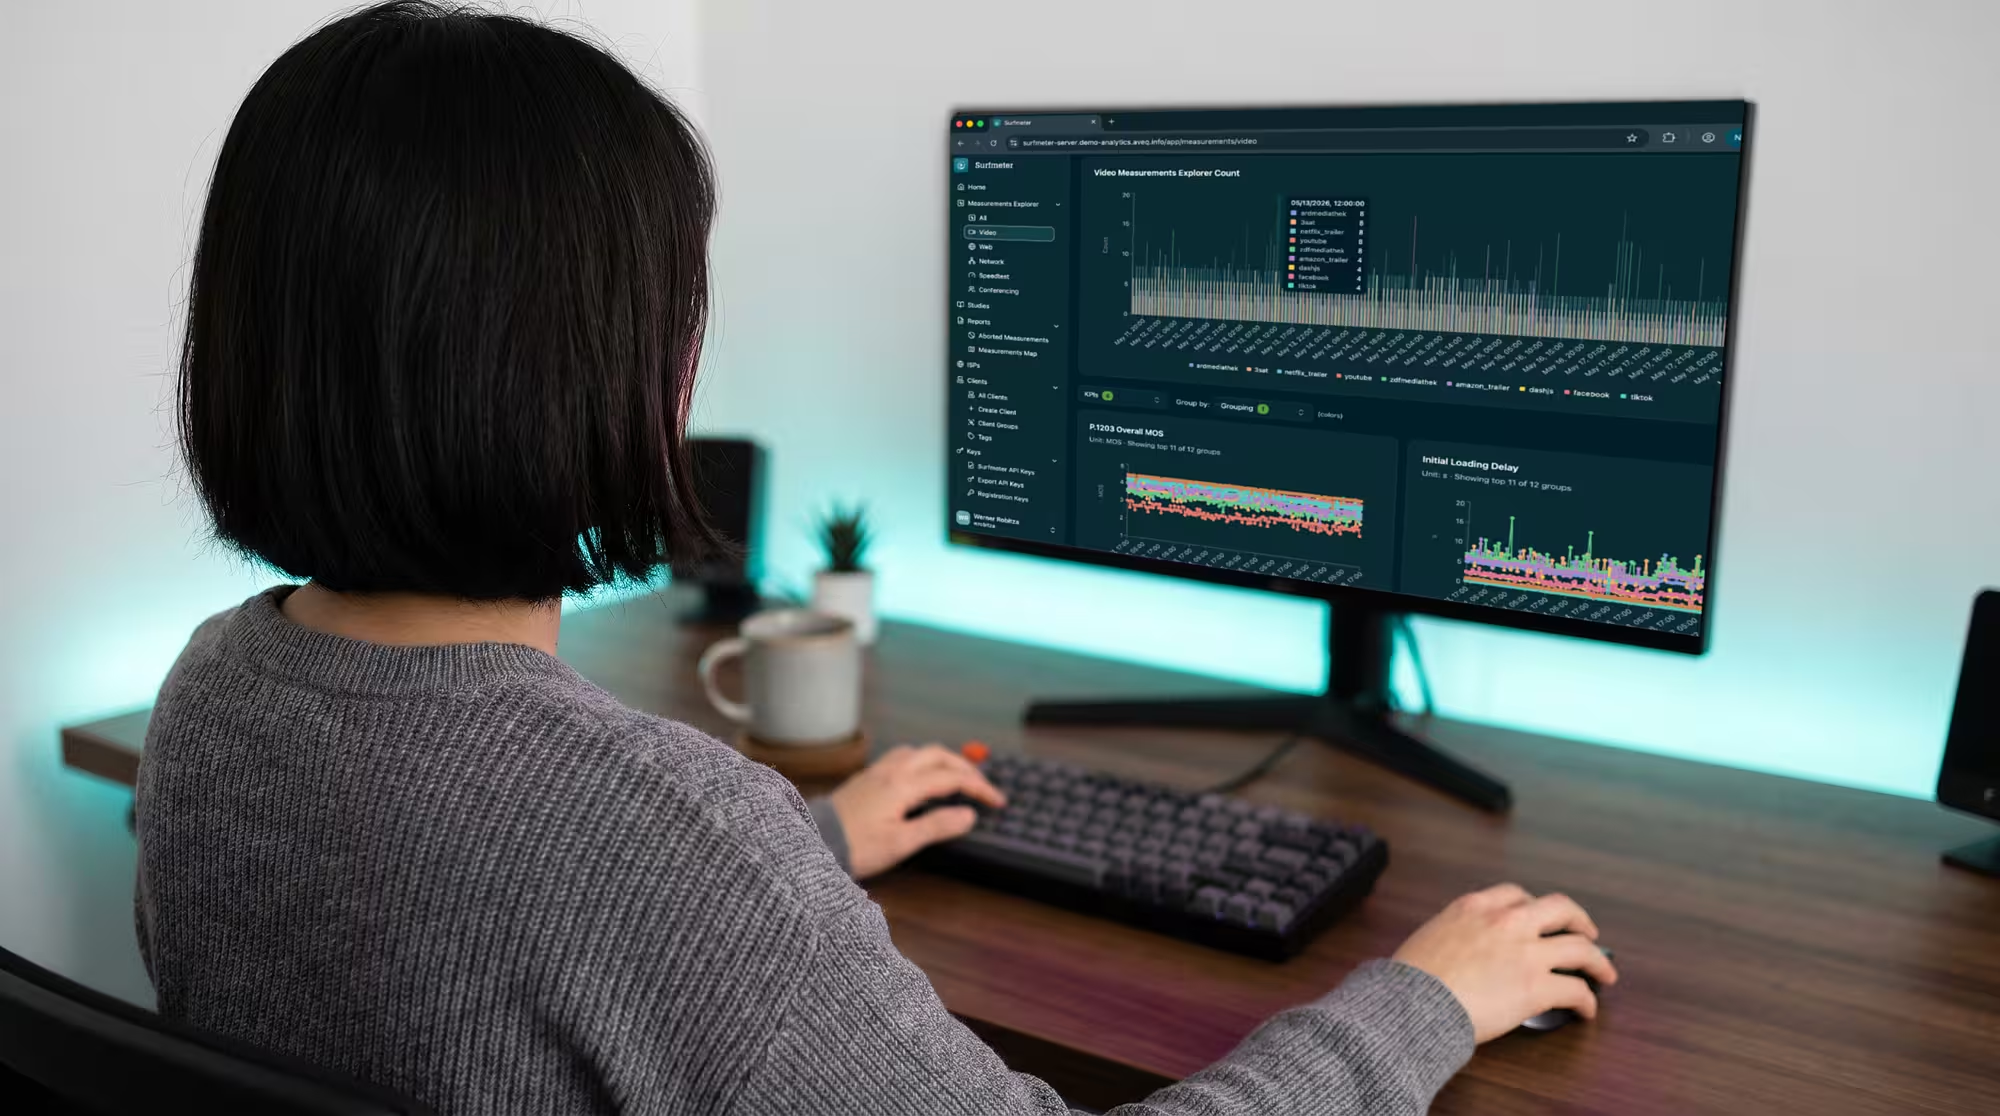
Video QoE Testing
Automated playback tests against real OTT services with ITU-T P.1203 MOS scoring. Measures loading delay, stalling, bitrate adaptation, and resolution quality.
CLI-based automation for scheduled QoE and QoS measurements.
Deploy lightweight probes on Linux machines, Docker containers, or VMs to continuously measure video streaming quality, web performance, and network health. Automate everything from a single configuration.
Product Overview
The Surfmeter Automator is a headless, CLI-driven measurement engine. It runs scheduled test sequences against real OTT streaming services, websites, and network endpoints — producing standardized quality metrics without any manual intervention. Ideal for always-on probing infrastructure.

Award-winning solution
The award-winning Surfmeter platform behind the Automator is built for continuous QoE and QoS testing — giving probe-based monitoring a proven foundation for serious streaming operations.
Key Features
Automated playback tests against real OTT services with ITU-T P.1203 MOS scoring. Measures loading delay, stalling, bitrate adaptation, and resolution quality.
Chromium-based page load measurements capturing Core Web Vitals: Largest Contentful Paint, First Contentful Paint, Time to First Byte, and more.
Download/upload speed measurements, latency, jitter, packet loss, and traceroute diagnostics for end-to-end network path analysis.
Configure test sequences, intervals, and service targets through a single configuration. Run continuously or on-demand.

Most videos watched today are shorts, and nobody watches just one. The Automator swipes through YouTube Shorts and TikTok feeds the way a viewer does and treats every video as its own measurement. You get initial loading delay, resolution, bitrate, and P.1203 MOS per video. By default a test covers 5 videos with 8 seconds of viewing each, and both values are configurable.
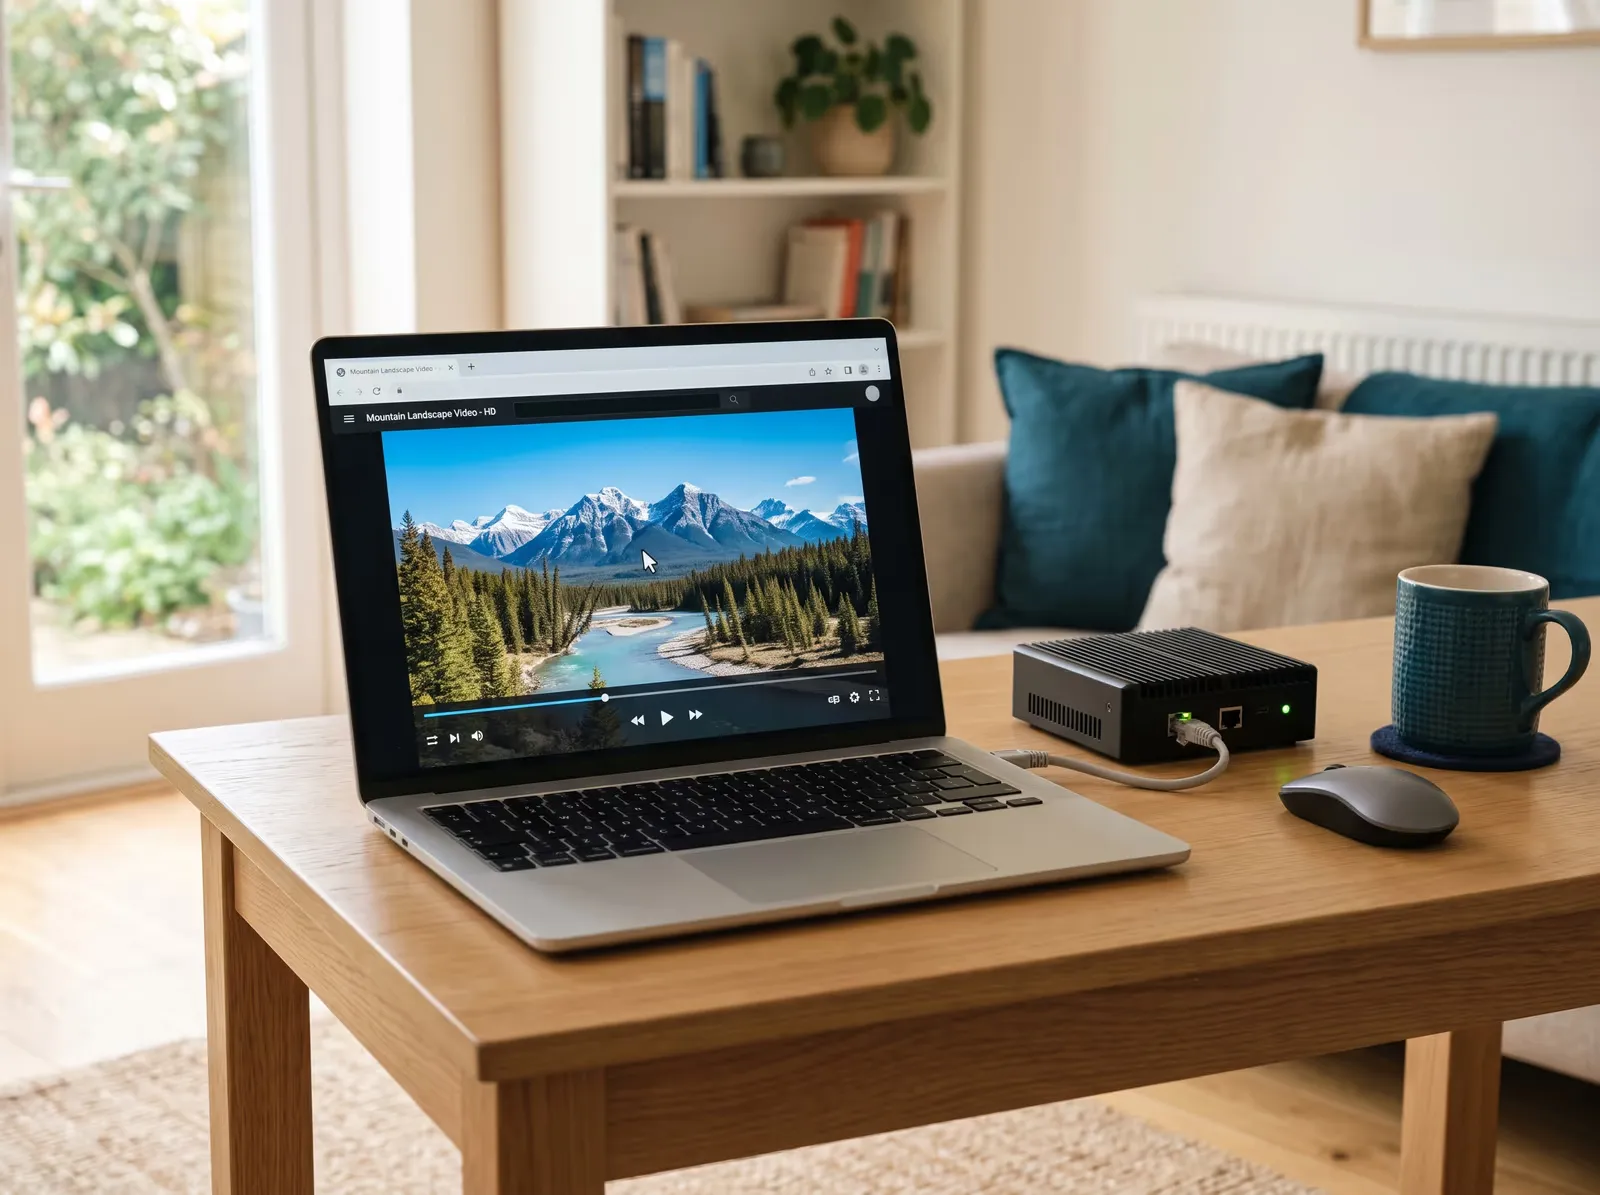
The Automator drives a real browser. It opens the service, starts playback, and watches the stream the way a person at home would. What it measures is what your customers see on their screens.
The same Automator on every host
Pick the host that fits each location. Hover over or tap a tile for details.
Configuration
One configuration per probe defines which services to test, the schedule, and the test parameters. The format is the same on every host.
Linux machine
A mini PC, NUC, or server on Debian or Ubuntu. Place it behind a subscriber line or at any site you want to test.
Virtual machine
A VM in your data center or in cloud compute. It needs no extra hardware and suits tests from your core locations.
Docker container
Run the Automator as a container on any host with Docker, next to the services you already operate.
Raspberry Pi
A small probe for field sites, hotels, and vehicles such as trains.
Surfmeter Dashboard
Every probe sends its results here, whichever host it runs on. You can compare probes, services, and locations.
Install the Automator on a small physical probe, a virtual machine, or a server in your data center, or run it as a Docker container. Debian and Ubuntu based systems and Raspberry Pi are supported. One configuration defines what each probe tests and when.
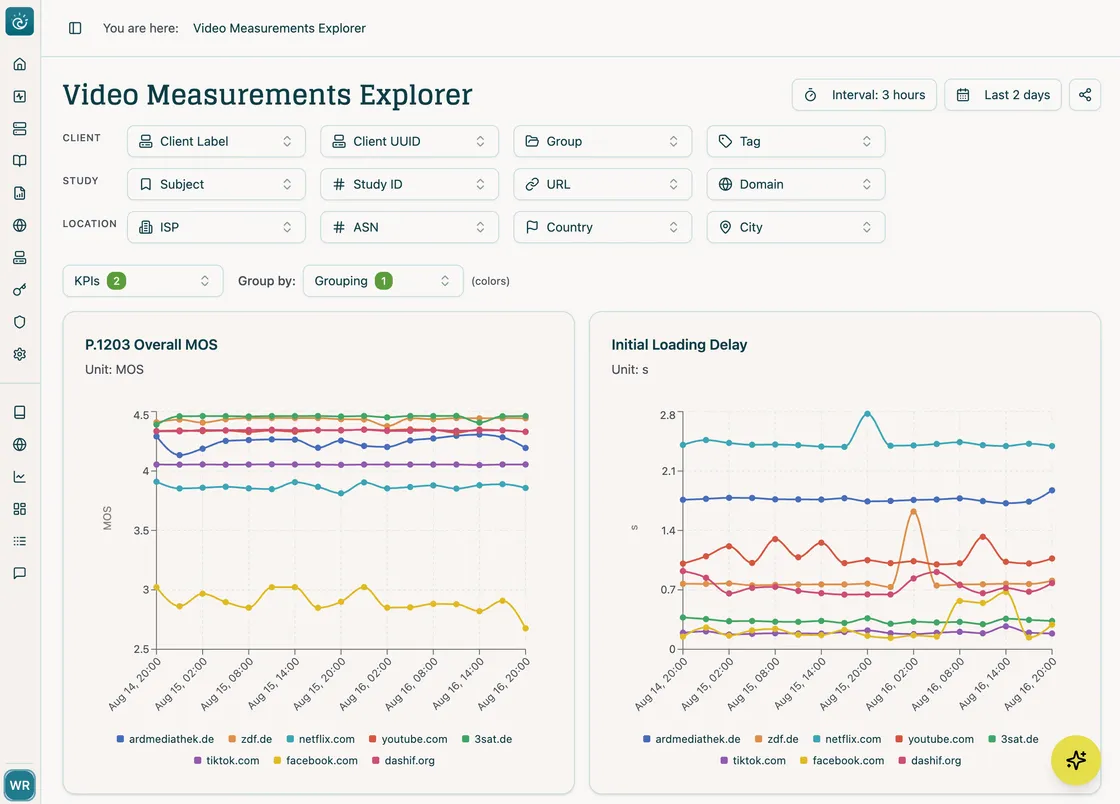
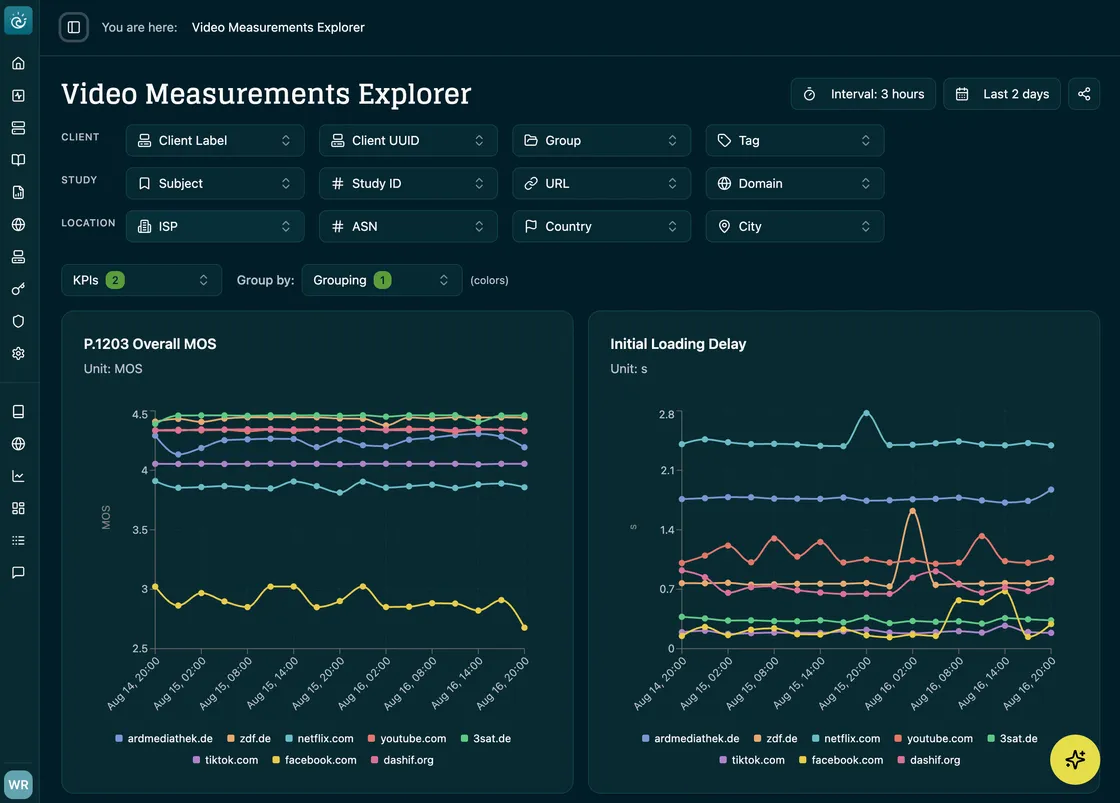
Every measurement goes to the Surfmeter Dashboard. Compare probes, services, and locations over time, see color-graded KPIs at a glance, and open any single session to see its full playback timeline.
Explore the Surfmeter DashboardThe cause is a degraded peering link
Probes 2 and 3 reach the same CDN, but only the path over Transit B scores low.
Example data. Hover over or tap a tile for its numbers.
Probe 1
Tests video over IX Vienna to CDN A.
Probe 2
Tests video over Transit B to CDN B.
Probe 3
Tests video over PNI to CDN B.
Your core network
Probes 1 and 3 score well through the core. Your network is not the cause.
IX Vienna, public peering
Probe 1 scores well over this link.
Transit B, upstream transit
Latency and packet loss jump at this hop in the traceroute. Only the probe on this link scores low.
PNI, private peering
Probe 3 reaches the same CDN over this link and scores well.
CDN A
Probe 1 scores well on this CDN.
CDN B
Probe 3 scores well on this CDN. The CDN is not the cause.
The cause is a CDN
Probes 2 and 3 reach CDN B over different links, and both score low. Probe 1 on CDN A scores well.
Example data. Hover over or tap a tile for its numbers.
Probe 1
Tests video over IX Vienna to CDN A.
Probe 2
Tests video over Transit B to CDN B.
Probe 3
Tests video over PNI to CDN B.
Your core network
Latency and packet loss look normal through the core.
IX Vienna, public peering
Probe 1 scores well over this link.
Transit B, upstream transit
Latency and packet loss look normal on this link, although the score is low.
PNI, private peering
Latency and packet loss look normal on this link, although the score is low.
CDN A
Probe 1 scores well on this CDN.
CDN B
Both probes on this CDN score low over different links, and the network data looks normal.
The cause is in your network
All three probes score low, although they use different links and CDNs. The core is the only hop they share.
Example data. Hover over or tap a tile for its numbers.
Probe 1
Tests video over IX Vienna to CDN A.
Probe 2
Tests video over Transit B to CDN B.
Probe 3
Tests video over PNI to CDN B.
Your core network
Latency and packet loss rise at this hop on every path.
IX Vienna, public peering
The probe on this link scores low, and so do the probes on the other links.
Transit B, upstream transit
The probe on this link scores low, and so do the probes on the other links.
PNI, private peering
The probe on this link scores low, and so do the probes on the other links.
CDN A
Scores are low on this CDN, and on the other CDN as well.
CDN B
Scores are low on this CDN, and on the other CDN as well.
Video results come together with network data such as traceroute, latency, jitter, and DNS. When a QoE score drops, you can see whether the cause is your own network, a CDN, or a degraded peering link.
Learn about CDN performance analysis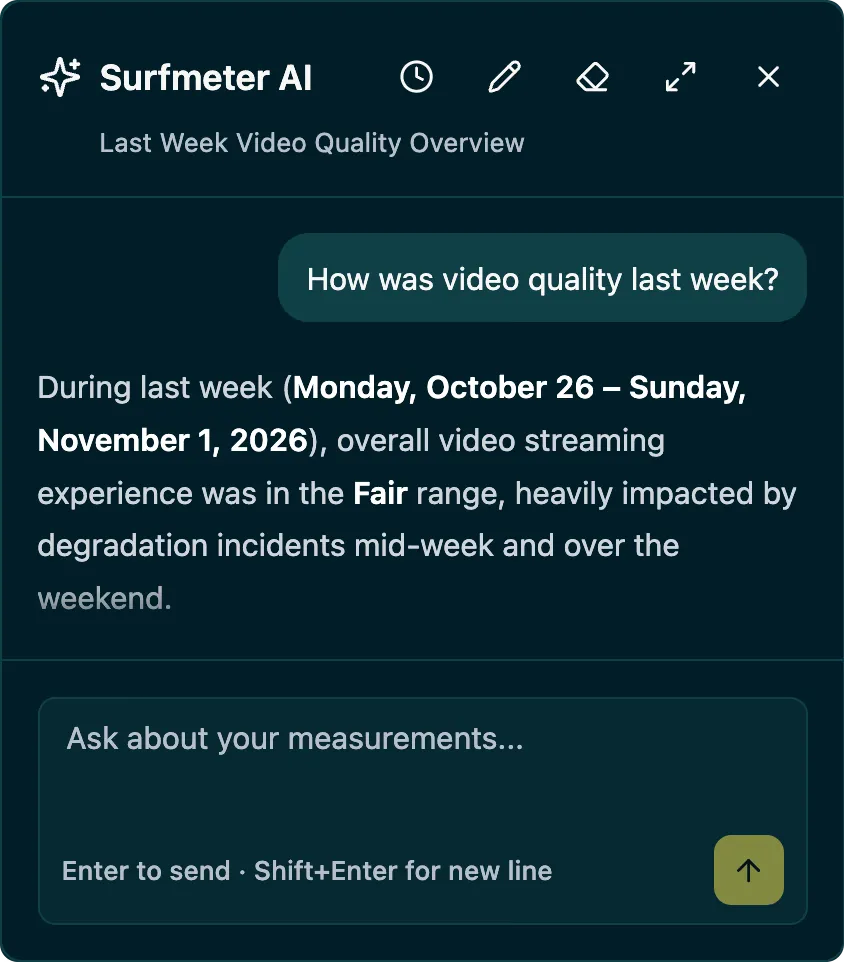
The AI assistant in the dashboard queries your measurements, explains individual results, and surfaces trends. It works with your current filters and time range. You get from a question to an answer without building a report first.
Proven in Practice
“We are delighted to have AVEQ, a renowned expert in the field of video streaming analyses, on our team.”


zafaco and AVEQ collaborate to establish new standards for measuring and optimising video streaming quality for broadband providers in the DACH region. Surfmeter’s QoE algorithms enable standardised quality ratings for international services like YouTube, Netflix, and TikTok, as well as national broadcasters and media libraries — based on ITU-T standards and the latest research. Together, they analyse IPTV streaming quality of leading broadband providers across Germany, Austria, and Switzerland in a complex test setup covering realistic end-user scenarios.
Results
“We're using Surfmeter to gain unprecedented visibility into our network performance through automated, active measurements that simulate actual streaming video quality, exactly as end-users experience it”


Gcore, operating a global CDN with 210 points of presence across six continents, needed deeper insights into the interactions between streaming applications and their edge network. Traditional server-side monitoring couldn’t capture what end-users actually experience. With Surfmeter, Gcore gained real-world QoE visibility by measuring actual video streams from the same platforms and players that end-users rely on.
Results


Creanord, a Finnish provider of network quality monitoring solutions, wanted to extend their probe-based platform with video streaming QoE metrics. By integrating Surfmeter Automator as a measurement component, they added ITU-standardized video MOS testing to their existing network monitoring infrastructure.
Results
Probe deployment
Run Automator on VMs in your core and data centers, and on Surfmeter Probes behind subscriber lines. Each one tests the services your subscribers use and sends its results to the same dashboard.
Scroll sideways to see the whole network.
How It Works
The Automator runs on any Linux-based system — physical probes, VMs, or Docker containers. No GUI required.
Install the Surfmeter Automator on your target hardware or VM. Supports Debian/Ubuntu-based systems, Docker, and Raspberry Pi.
Define which services to test (Netflix, YouTube, websites, speed endpoints), set schedules, and specify test parameters in the configuration.
The Automator executes test sequences on schedule — launching browsers, playing video streams, running speed tests — all headless and automated.
Measurement data flows to the Surfmeter analytics platform. View dashboards, set alerts, compare locations, and export raw data.
Use Cases
Get a personalized demo and see how Surfmeter fits your use case.
Data & KPIs
See how the Surfmeter Automator fits into your measurement infrastructure. Get in touch for a demo.
Thank you! We'll get back to you shortly.
Something went wrong. Please try again.