
Network Performance Tests made easy with our QoS Dashboard
If you are operating a network or serving your traffic over different networks, ensuring performance and stability is likely one of your most important goals. Our Surfmeter Analytics Dashboard allows you to set up various visualizations of network and service performance, with possibilities to compare across different networks, regions, devices, or services.
In our previous post, we already showed you how our Analytics Dashboard can help you analyze the Quality of Experience of video streaming services — but we also offer in-depth metrics on underlying network performance. In this post we’ll focus on other metrics:
- Web browsing speed
- Ping & DNS performance
- Speed test results / throughput
… as well as the various customizations that are possible with our Dashboard.
The most important Web KPIs — readily available
While certainly not as traffic-intensive as video streaming, web browsing is a daily activity for all Internet users and equally important to the overall Web experience. Slow loading websites contribute to user frustration — improving browsing speed on the other hand is, for example, known to increase conversion rates in online shopping.
Recently, analysis tools like Google’s Core Web Vitals have helped service providers better understand their web performance — Web Vitals include metrics like the First Contentful Paint (FCP), a measure of “how long it takes the browser to render the first piece of DOM content after a user navigates to your page.” But other metrics such as the Page Load Time (based on the window “load” event) or the Document Ready Time (based on “DOMContentLoaded”) have been around for much longer and are still being used to judge the performance of web browsing across a set of web pages and devices. These are part of the standard W3C Navigation Timing specification.
With Surfmeter, you’ll have access to the most important web metrics directly in your dashboard. Just set up the URLs you want to measure, and we’ll provide (among others) the following results immediately:
- Page Load Time
- Document Ready Time
- First Contentful Paint (FCP)
For instance, in the following chart, we see average page load times across a set of 10 web sites, compared among three different test devices.
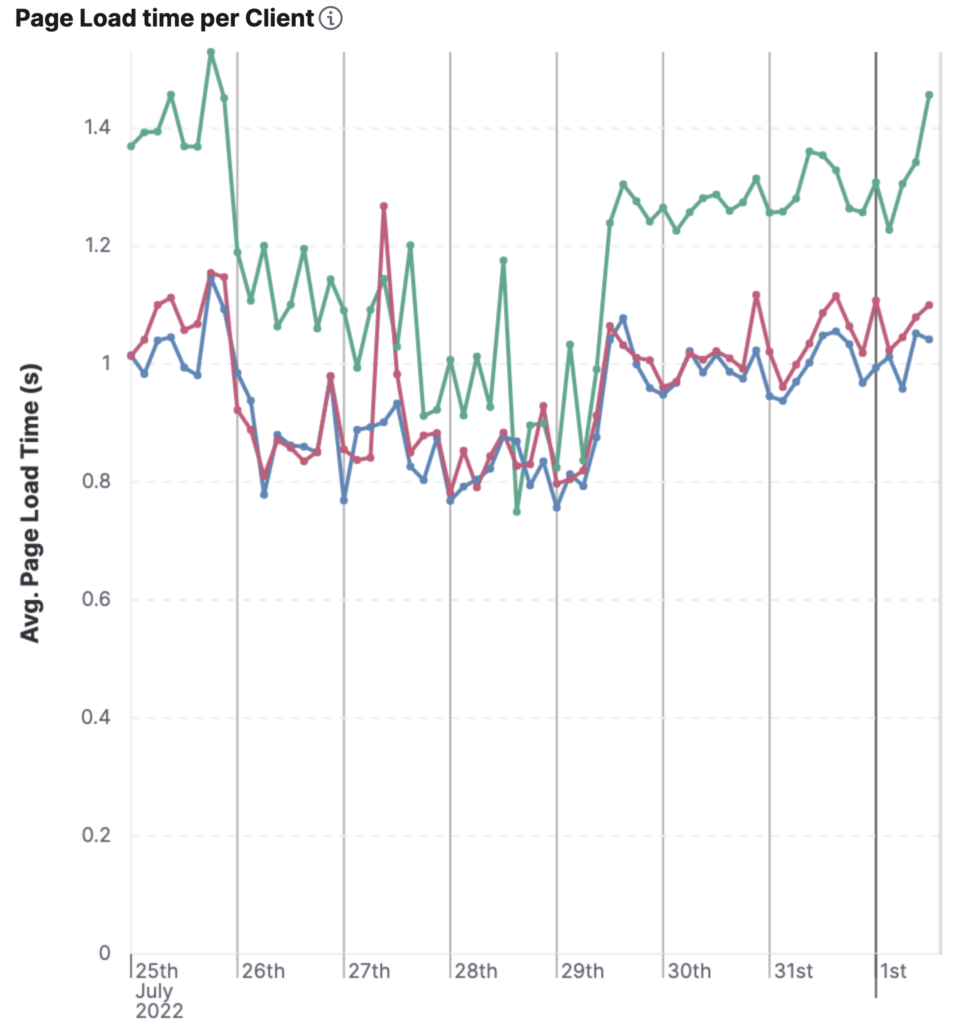
We can immediately see that one device performs significantly worse than the others. The reason is simple: it has a slower network connection and can therefore not load pages as quickly as the others. Does it matter for the first impression of the page?
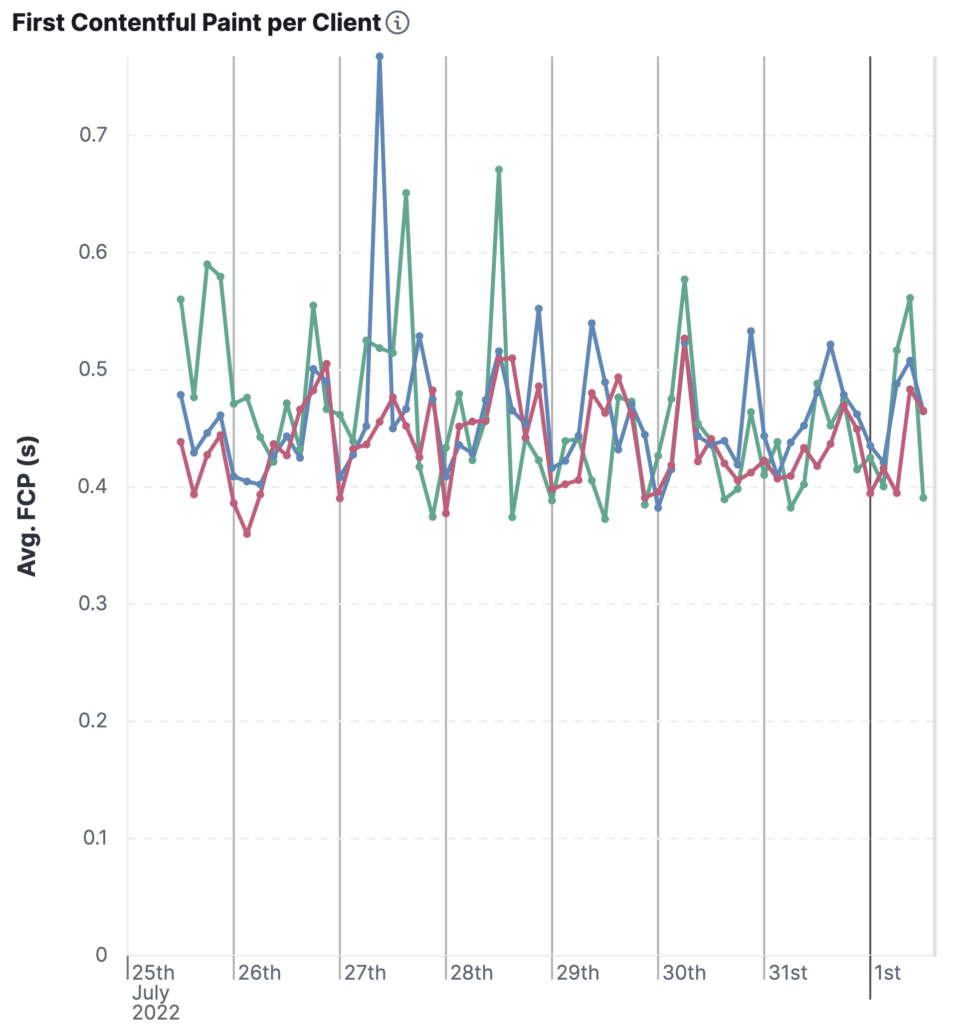
If we look at the FCP metric instead (see the next graphic), we notice that there is no difference between the individual devices despite their differences in product bandwidth. The time to FCP is much shorter than the page load time, and this means that the first content can be served rather quickly.
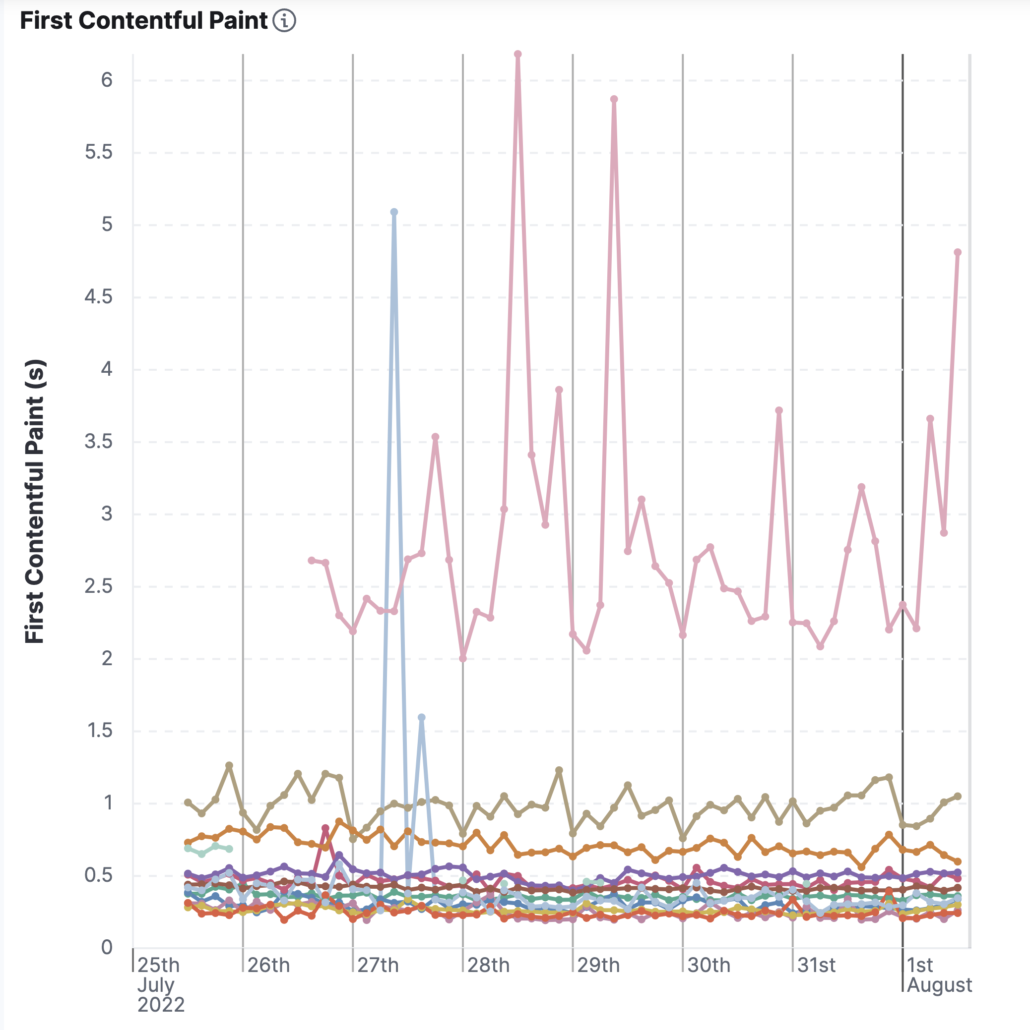
Web page loading is a complex task involving dozens of requests against multiple servers, and obviously the complexity of the website itself has a strong impact on the loading performance. In the following chart we show FCP compared across various websites — here some low-performing candidates are immediately visible, but also some outliers that deserve further investigation.
With Surfmeter, you can easily schedule tests of different sets of websites. Run them hourly or even on a minutely basis to get immediate feedback on what matters to your users. We’re already building in support for more Web Vitals metrics, so watch out for that feature in the coming months. To summarize, our Web suite of tests checks all the boxes for what you need to gauge users’ web browsing performance.
Ping and DNS resolution times — the essentials
What would the Internet be without its underlying protocols? ICMP Ping messages are frequently used to measure round-trip times against various servers. Unimpacted by traffic shaping or congestion control measures like with TCP, simple ping packets can tell you a lot about the theoretical performance of a network.
Surfmeter allows you to run ICMP Ping tests against any host you want to test — be it an internal or public IP. Again, let’s look at a set of different servers to see what a visualization of ping performance could look like.
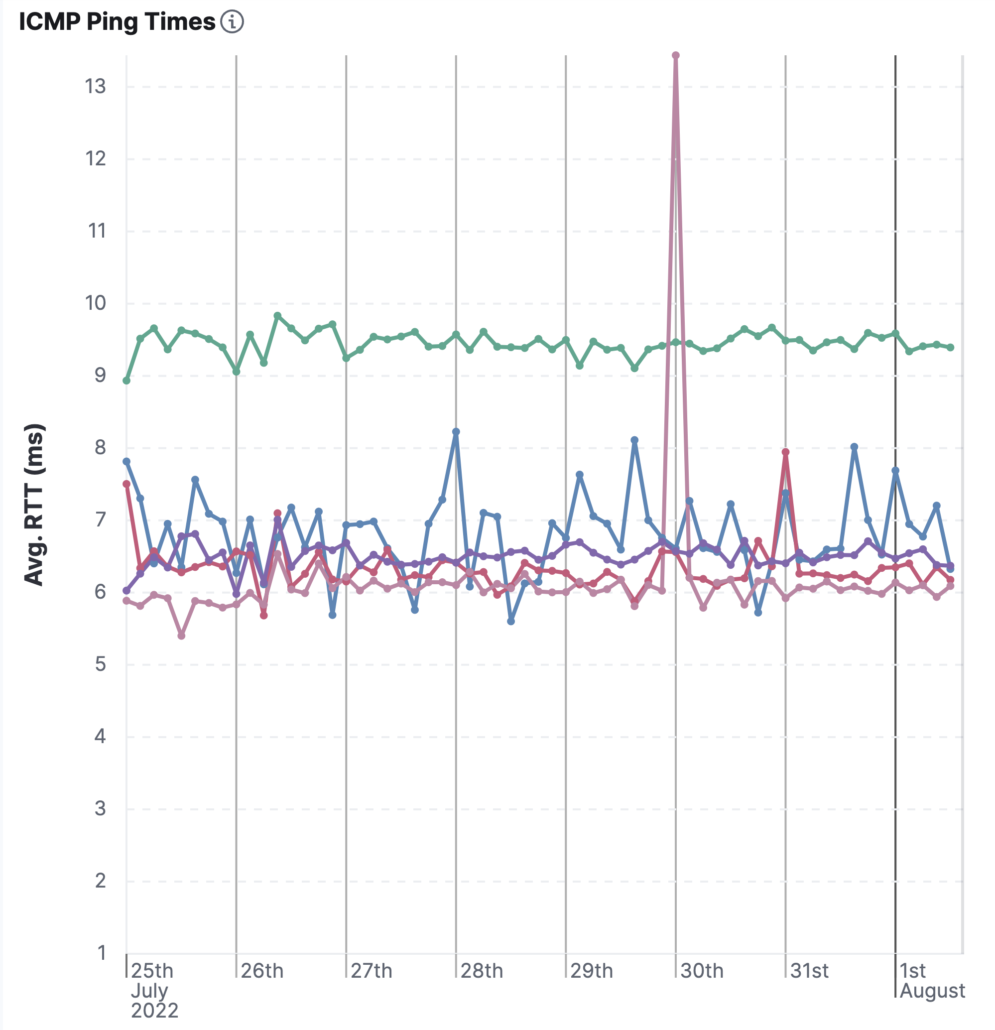
Here, we’ve compared five different servers that offer a similar type of service to the end-users. We notice that in principle, round-trip times are quite fast with values of below 10 ms, but one server performs significantly worse than the others. One spike can be seen, which would warrant a deeper investigation into the service and whether there are visible problems that may arise for the end user.
The same type of measurement can be done with DNS resolution times. As DNS uses caching in various places (e.g., in the browser, on the local device, the router, or upstream servers), we provide a way to randomize the list of tested DNS servers on a daily basis. This means that each set of domains tested will vary, very likely defeating existing caches and giving you a more representative result of the delays a user would get.
As you can see, it’s not just the end-user perspective that matters to us: we also want to make sure the underlying network metrics are there to give you indications of possible sources of error. Our holistic approach to QoS and QoE measurement can help you diagnose service issues quickly and accurately.
Good old TCP-based speed tests
When a user wants to find out more about their own network performance, they usually turn to speed tests. They’ve been popularized over the last years, not only as means for home users to detect service issues, but also to verify that you’re actually getting what you’re paying for. Regulators like the FCC are even asking users to check their speed and report any issues.
With Surfmeter, we support a variety of speed tests. You can run speed tests through the browser, like https://fast.com/, which is hosted on the Netflix CDN and therefore gives you a good impression of the maximum throughput attainable for video streaming, or https://speedtest.net, which is probably one of the most well known tools.
Here’s a set of gauges showing you the average speed test result from a web speed test over time.
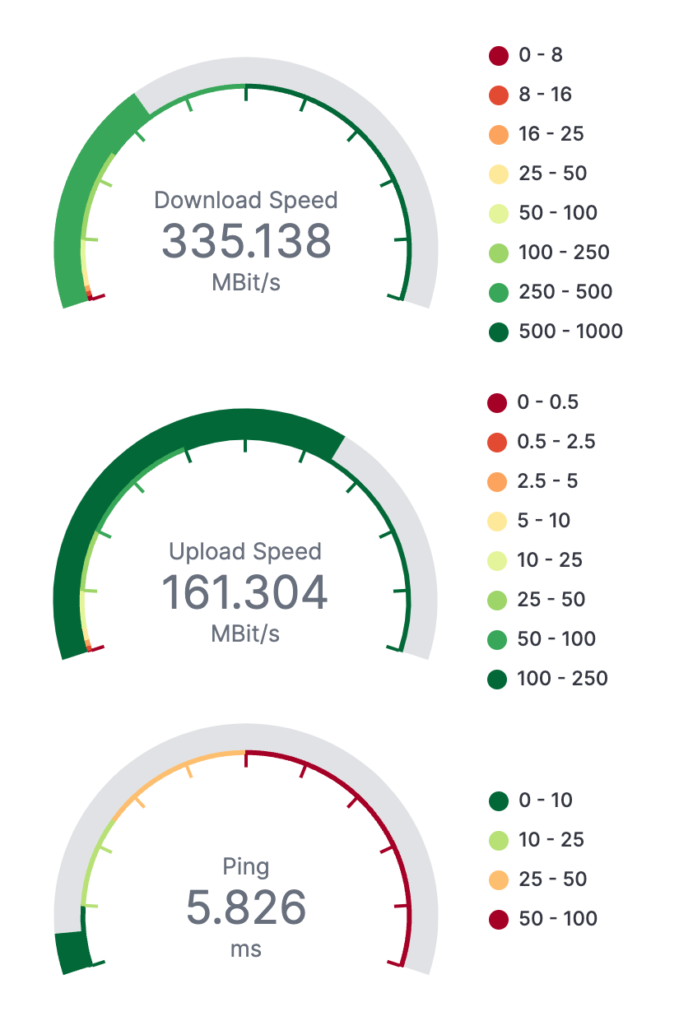
As you can customize almost everything in terms of visualization, the thresholds can be defined freely, allowing you to quickly see issues with bandwidth.
But that’s not all: we can also instrument any command-line based speed test tool. For connections with bandwidths exceeding several hundred MBit/s, it is known that web browser-based speed tests are not accurate enough due to timing issues inside the browser. TCP-based speed tests may also not show the full potential of an underlying connection due to the protocol overhead. Hence, UDP-based speed tests (such as this one) are also possible.
Never miss out on the essential metrics for network performance with our Surfmeter Dashboard. In conjunction with automated test probes, you’ll be set up in no time to monitor your critical infrastructure.
Fully customizable views for your needs
We know that not every setup is the same. Your requirements may differ in terms of what different stakeholders need to see. That’s why our Dashboard offers you full customization possibilities including the following benefits:
- Unlimited number of visualizations and dashboards, which can be put together through a few clicks
- Various visualization types (line, area and bar charts, gauges, single numbers, …)
- Custom filtering possibilities (time range, ISP, service, geolocation, device ID or label, type of test, custom metadata, …)
- Access delegation to an unlimited number of users, including read-only access
So if all you need is a simple dashboard that you can open up every morning to check if everything is running fine, we have you covered. If you want to drill down into a particular metric for a specific device, that’s also possible. Do you need a time-series overview of the variance of page load times for a particular domain? Sure, we can do that.
Get in touch if you want to talk about your requirements or simply see a demo. We’re happy to show you more example results or discuss how to best design a monitoring solution that fits your needs.

