QoE and SLAs: How to optimize the right metrics

If you provide an Internet-based service, it is crucial to ensure a high level of availability and quality for your users. Providers have always used Service Level Agreements (SLAs) to define criteria for uptime, latency, and other aspects of quality that can be measured from an application or network perspective.
However, as services become more complex and users demand higher levels of quality, it is becoming increasingly important to also consider user perception in the form of Quality of Experience (QoE). In this article, we’ll explore why combining QoE and SLAs is a perfect match for ensuring optimal service delivery to end-users, and how Surfmeter can help you define and meet your own criteria based on the actual users’ experience.
Why SLAs are not enough
SLAs have been around for a long time, and typically include factors like the general availability of the service or application, response time, uptime statistics and other parameters that you can easily measure from the network or other application logs.
As an Internet service provider, you have SLAs in place between you and your customers, or you and a reseller. Typical SLAs would include measures of Quality of Service (QoS): for example, available throughput (both upstream and downstream) and maximum packet latencies (ping). In practice though, it’s hard to tell what these metrics mean for a customer. QoS metrics can only inform you about the performance of your network or infrastructure, but they can’t really tell you if your users are happy with the service. For example, which throughput is needed to allow users to stream video in 4K? It really depends on the streaming service!
You could of course attempt to go one level higher: look at the services that people are using, and define your SLA/QoS measures there. For a video streaming service, for example, an SLA might specify that the service will be available 99.9% of the time, with an average video loading time of no more than 10 seconds per stream, and a minimum sustained video resolution of 720p. This helps you to define some quality criteria from the application perspective. But there are still issues with this approach.
Such individual metrics do not necessarily reflect how satisfied users are with the service, and in practice, they are complicated to handle. If you want to measure application KPIs, now you need a solution that can perform those measurements (hint: we have an automated platform that can be easily run anywhere in your network!).
But imagine you have dozens of individual Key Performance Indicators (KPIs) set up and tracked over time. How do you even define the individual thresholds for those KPIs? How do you make sure that each of the KPIs is correlated and weighted correctly to give you an accurate picture of how your service satisfies your users? Are you even optimizing for the right KPI?
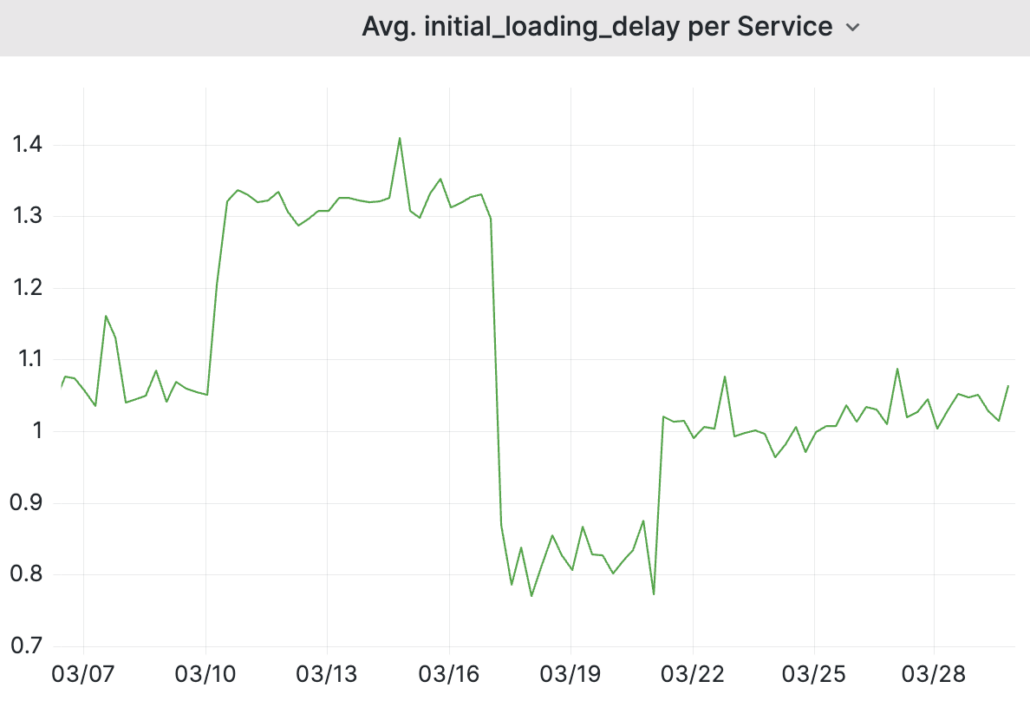
Let’s look at an example that we observed in the past month. Here’s a video service that, at some point, was able to load videos about 20% faster consistently across all our measurement probes, dropping from an average of 1 second to 0.8 seconds.

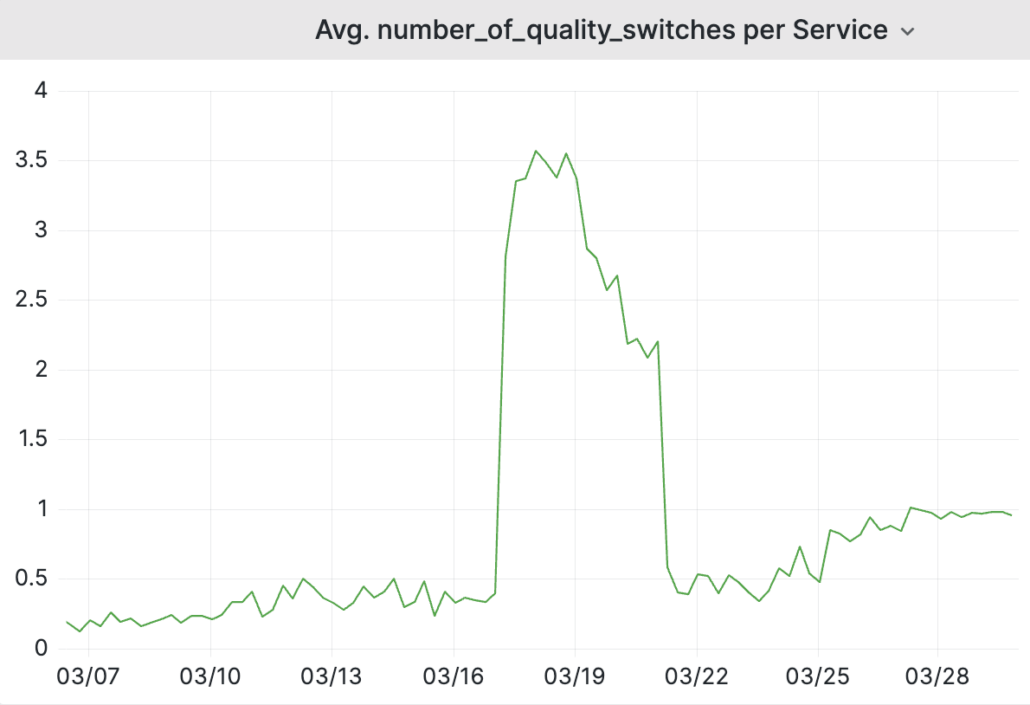
You might think: this is good for users. But then you should also look at other application-level KPIs. For instance, the number of quality (resolution) switches:

Notice that we now have up to 4 quality switches per session instead of 0 or 1. This coincided with a drop in overall average bitrate, since apparently the service was playing out lower resolutions first. This led to improved initial loading delays, but larger fluctuation in video resolutions. So what does this mean for the customers? This is where QoE comes into play.
How do QoE measurements work?
QoE takes into account multiple factors that affect the end-user experience. Let’s look at video streaming as an example. Instead of underlying network features (like throughput), we must look at application-level features and integrate them according to how users experience a streaming session. Initial loading, for example, is just one of those factors. Others include the video resolution, the amount of video quality changes over time, any stalling happening during playback, and the quality of the video content itself. Our Surfmeter solution can be used to automate video streaming measurements for video services of your choice. We output all the relevant metrics for your to monitor and base your SLAs on — as we have seen in the charts above.
But while it’s possible to calculate metrics (KPIs) for each of those factors separately, the user’s overall experience will depend on how those factors interact with each other. Here, QoE models are the best solution — they can derive a single score or rating that represents the user’s experience as a whole, taking into account all of those individual factors. In our case, we rely upon a QoE model that has been trained on a thousand different video sequences, all rated by hundreds of real users. The model understands the impact of those KPIs on the overall experience and uses machine learning algorithms to predict QoE scores based on the streaming session’s characteristics. Surfmeter outputs a single QoE score, and we argue that this is all you need at first — especially for SLAs.
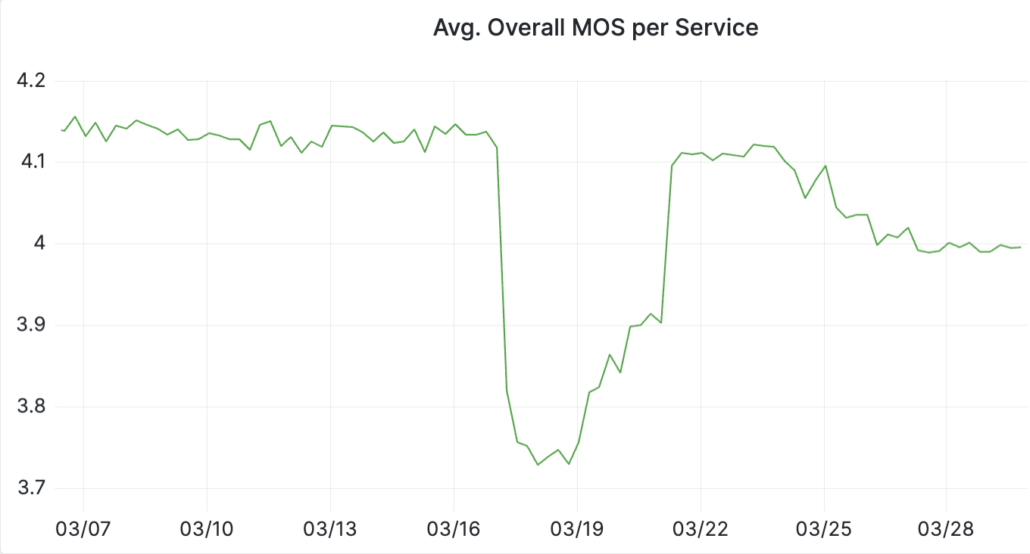
In the above case of our streaming service dropping its initial loading time, did that affect the customers in any way? It turns out yes!

The MOS dropped significantly from a stable “good” (> 4) to a “fair” rating. Customers will be able to notice that. The improvement of initial loading delay did not help — on the contrary, the increase of quality switches led to a lower overall QoE for the users.
Tuning for individual KPIs — overengineering and overprovisioning?
When tuning for individual KPIs, it’s essential to strike a balance between optimizing each metric and overengineering or overprovisioning your infrastructure. Consider initial loading delay as a factor. Optimizing for the fastest initial loading time and highest throughput may require a large amount of allocated network resources, which in turn can be expensive and inefficient. On the other hand, overly long initial delays and insufficient network bandwidth could result in a poor user experience and affect QoE negatively. Therefore, it’s crucial to analyze and tune individual KPIs based on their impact on the user experience as a whole, rather than optimizing each metric individually.
Also, when working with individual KPIs, setting a fixed threshold for each KPI may result in too strict boundary conditions that do not account for natural variations in network traffic or content quality. Maybe it doesn’t matter that one KPI exceeded its threshold when the overall experience was unaffected. For example, a lower overall video resolution may not be a big issue when there was no strong fluctuation in quality over time. This is because we know from our QoE model that quality oscillations lead to bad user ratings.
Working with QoE scores makes it possible to use perceptual thresholds instead of fixed ones, allowing for a more nuanced approach to optimization. The following figure shows the two approaches compared.

On the left side, you see a typical QoS-based view. Two parameters on the x and y axis have a certain range of possible values, and the thresholds are fixed, as indicated by the dashed lines forming a cross. You can imagine that QoS parameter 1 could be initial loading time, and QoS parameter 2 could be the degradation due to low video resolution. The bottom left quadrant would mark the area in which you fulfill your SLA. However, reaching a threshold in either of the QoS parameters would lead to the SLA criteria not being reached. Is this realistic? Imagine that the initial loading delay for a stream could be a tad longer — but on the other hand you get a nice and crisp 4K video playback as a result. This isn’t necessarily bad.
Instead, a QoE-based approach takes into account the overall user experience, combining multiple KPIs through an algorithmic model that is calibrated based on user feedback. When you now vary the two QoS parameters along their axes, the output of the QoE model corresponds to the yellow line — the perceptual threshold. Here, we can easily see that a long initial loading delay could still lead to a good overall score, as long as the other QoS parameter (such as video resolution) compensates for it. Optimizing along the perceptual threshold leads to the most efficient improvement of user experience since KPIs that exceed their thresholds do not necessarily impact QoE negatively.
In summary, while optimizing individual KPIs is important for providing the best service possible, it’s essential to keep in mind that an overemphasis on any one metric can lead to overengineering or overprovisioning. Ultimately, this costs you money that you could spend elsewhere.
Why you should adopt a QoE view for your SLAs
Adopting a QoE-based view for your SLAs allows you to prioritize the overall user experience and optimize along perceptual thresholds, leading to better resource utilization and, overall, happier customers. If you have SLAs in place that focus on simple network metrics— or some application metrics — you will benefit from adding QoE-based measurements to your portfolio. These will help you understand how your customers really experience your service.
It’s important to keep in mind that whenever you do QoE measurements, you do not lose the existing view of KPIs. They are still there and ready for you to inspect if you need to dig deeper. We always provide data for the underlying technical factors should you need it. Video streaming is the prime use case here, but our platform also covers web browsing — now with Google Lighthouse support. And we do ping and throughput measurements as well, just for good measure (no pun intended!).
Talk with us to see how our Surfmeter-based solution can help you measure and monitor those QoE metrics!


