Now Shipping: Google Lighthouse Web Metrics

There was a time when it was enough to wait for a “load” event to know that a web page was loading. This is no longer the case. As websites become more complex — through media assets or interactive elements — it’s no longer easy to determine the user experience for a browsing session. As part of our vision to provide a single platform for measuring quality of experience, we now support Google Lighthouse web performance metrics. Read on to learn more!
It’s important for network and content providers to understand how well their services are performing for their end users. Users are interested in a fast and responsive experience, and they generally consider a site to be loaded when the content appears and does not move around too much. Conversely, if a news site takes forever to display the main image, or if elements move around wildly, it will be a bad experience. Measuring throughput alone is not enough to quantify the customer experience when browsing different websites. Especially in web browsing, the complexity of websites varies greatly between different types of content. For example, a news site will have a different structure and set of media assets than a search engine home page.
The “good old” DOM and load events
It used to be enough to simply measure the DOM content loaded event, which tells you when the HTML document has been completely parsed, and the “load” event, which indicates when the entire page is loaded. But both of these metrics have their problems. The DOM load time will sometimes be very low, since execution of resources like Javascript can be deferred to happen later. The DOM might be parsed, but things are still happening on the website! You could measure short DOM load times but still experience extremely long page load times as a result.
Especially with complex pages, simply measuring the “load” time is also very misleading. The problem with measuring load time alone is that it doesn’t take into account the content that is hidden “below the fold”. What is that, you ask? The fold is a term used to describe the part of a website that is visible to the user without having to scroll down. This means that even if the visible part of the website loads quickly, there may be additional content below the fold that takes longer to load, shifting the technical “load” time, while a user might think that everything is fine. In fact, how users experience web loading is a complex subject, and lots of research has been done on it.
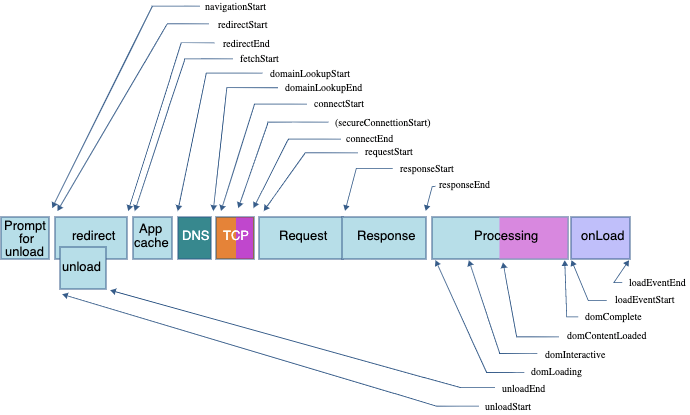
Our Surfmeter solution has always supported measuring these two metrics as part of our web test suite. Surfmeter allows you to define a set of web pages and measure their loading performance in sequence. Of course, we make sure we have the right environment for those measurements, by clearing all cookies, and prefetching DNS records if needed. The W3C Performance Navigation Timing spec is what we use internally to achieve this. The following figure shows all these metrics in context:

But we’re now at a stage where it’s time to retire enhance those metrics, and we’re happy to announce that we now fully support Google Lighthose Core Web Vitals. With Google Lighthouse web performance metrics, we can now provide a more comprehensive evaluation for network and content providers.
How Google Lighthouse Metrics work
Google Lighthouse is an open-source tool that provides insights into the performance, accessibility, and user experience of a website. These metrics are calculated through a combination of browser-based measurements and simulated user interactions, such as scrolling or clicking through the site. Some of the key metrics provided by Google Lighthouse include:
First contentful paint (FCP) measures how quickly a user can see the first visual element of a web page. It’s an important metric because it tells you how quickly the page is loading and whether users can start engaging with the content. A fast FCP means users will perceive the page as fast and responsive, while a slow FCP can lead to frustration and abandonment. FCP is measured in seconds and should ideally occur within 1.5 seconds of when the page first starts loading.
Largest contentful paint (LCP) is a metric that measures the time it takes for the largest visual element on a web page to load. It’s a crucial metric because it reflects the perceived loading speed of the page. A slow LCP can lead to a poor user experience, while a fast LCP can make users feel the page is fast and responsive. LCP is measured in seconds, and to provide a good user experience, it should occur within 2.5 seconds of when the page first starts loading.
Time to first byte (TTFB) measures the time it takes for a user’s browser to receive the first byte of data from a web server after requesting a web page. It’s a critical metric because it reflects the server’s performance and network latency. A fast TTFB means the server is responding quickly, while a slow TTFB can indicate issues with the server configuration or network. TTFB is measured in milliseconds, and a good target is 200 milliseconds or less.
Cumulative layout shift (CLS) measures the visual stability of a web page by quantifying how much the layout shifts as the page loads. It’s an important metric because it reflects how stable the page is for users and whether they’re able to interact with it without accidentally clicking on the wrong element. A low CLS means the page is stable, while a high CLS can lead to a poor user experience. CLS is measured on a scale from 0 to 1, and to provide a good user experience, pages should maintain a CLS of 0.1 or less.
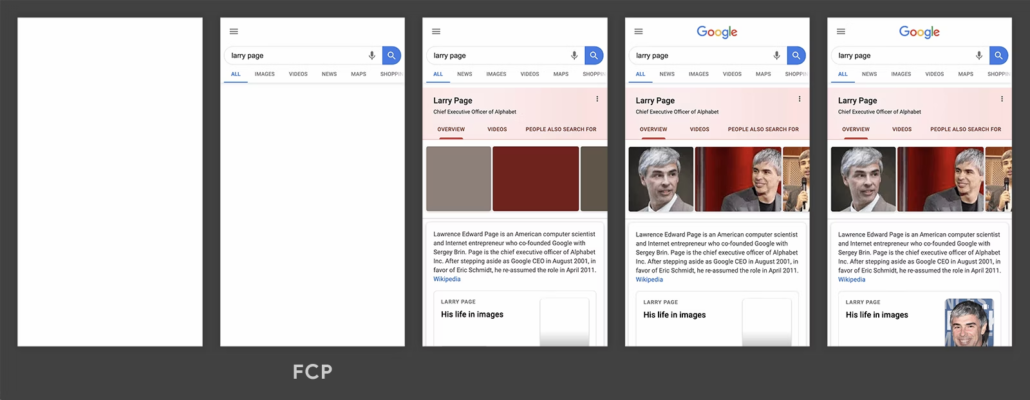
For FCP, for example, the following figure shows the timestamp at which a large image appears to the user, which people would interpret as an important (subjective) threshold for page load completion.

There are more metrics, some of which are less relevant to network-induced loading performance, and more related to the complexity of the page itself. As we typically investigate the effects of network bandwidth fluctuation on user experience, we don’t care as much about how complex individual websites are — or changes of per-website loading times over a course of several days or weeks. Instead, we can now reliably track page load performance across a set of automated measurement probes.
Finally, we should mention Google’s speed index. This is a combined metric, taking into account different core web vitals and weighting them based on their importance for overall user experience. There’s even a fancy calculator which we believe you have to play around with.

Now, granted, there is reason to doubt that the speed index is the holy grail of end-user QoE for web browsing. Researchers continue to test the accuracy of this index, showing that in some circumstances, the “classic” page load time may still be an important metric. On the other hand, Google must have enough data — both from the browser as well as the analytics side — to be able to infer how page speeds relate to aborted sessions and decreasing conversion rates. So it’s better to incorporate those metrics than to ignore them!
Use Lighthouse-based measurements now!
We now fully support Lighthouse and all its features in our Surfmeter desktop-based solution. Our measurements are completely configurable, allowing you to not only simulate different device types, but also various network conditions. We initially focus on the metrics we listed above, but you can extract a full Lighthouse report if needed, which gives you access to more internal metrics and scoring data in a structured manner.
But we hear you ask: why use Surfmeter when Google already provides an open-source tool? We’re glad you asked! Our platform offers much more than that. You can perform not only web measurements, but test the performance and QoE of any video streaming service. You can run the whole suite in Docker, on any machine, whether it has a display or not. We provide you with the dashboards you need to get a quick overview of all your measurement results. Fully interactive and configurable, of course.
Do you already measure page load times, but the “old way”? Want to see a demo and talk about how Surfmeter could help you? Contact us to find out more!


