Meet us at ANGA COM – June 3-5, Hall 7, C42 in Cologne/Köln
What is the Mean Opinion Score for video?
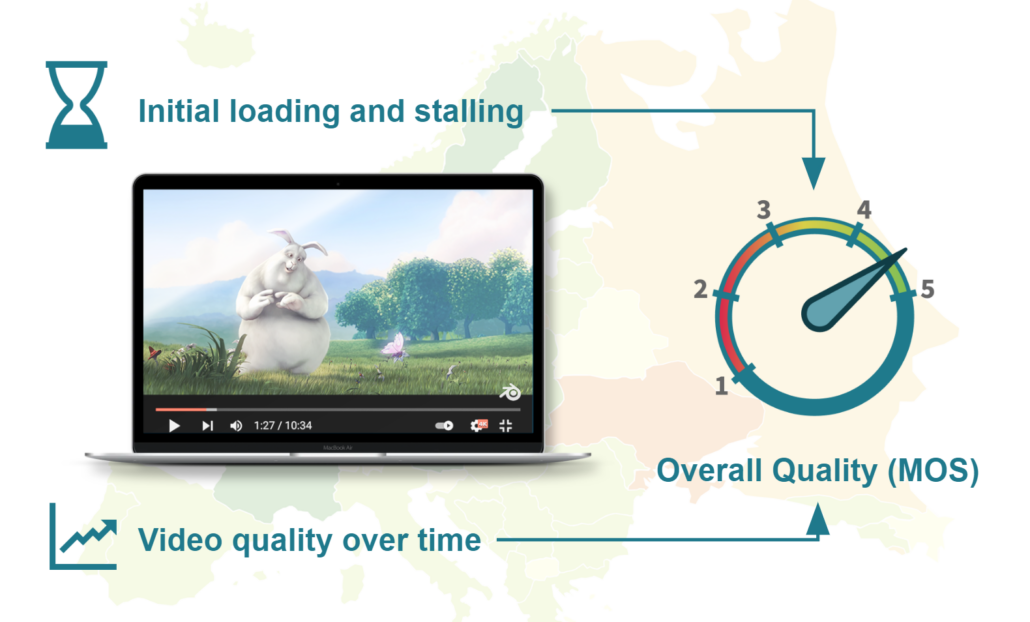
The Mean Opinion Score (MOS) is a single number that summarizes the quality of a video playback — all automatically, using modern algorithms.
The MOS includes all aspects of a video session like:
- Initial loading delay (startup time)
- Stalling events happening during the playback
- The fluctuation of audio and video quality over time
The MOS serves as an easy-to-understand indicator for the overall service quality, as experienced by the user. It fully considers the user’s perception.
Due to advanced algorithms that factor in different Key Performance Indicators (KPIs), you can gather MOS values without having to ask users for their opinion. Roll out large scale measurements knowing that the MOS can serve as a proxy for customer happiness.
Together with the MOS, you get all underlying diagnostic data and the usual QoS measures to help you perform root cause analyses for service problems, such as loading times and network statistics.
Complex inputs — but easy to understand. The Video MOS.
A high MOS indicates happy customers — without having to ask
Bring your users into focus
Measurements using the MOS can be easily aggregated, filtered, and visualized. MOS-based service monitoring quickly helps you identify bottlenecks and customer satisfaction issues — focusing on the user and not just on technical details.
Know where you stand against competitors
Do you want to know how well your network or your service performs?
MOS-based measurements can help you understand how your service offerings compare against others — all using a single number. The data can be based on automated measurements or real users via crowdsourcing campaigns.
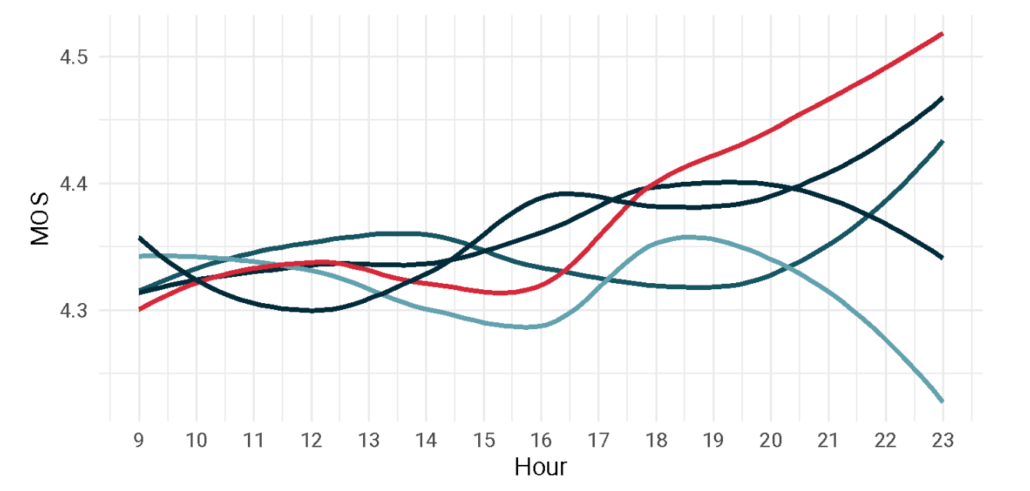
Example on the right: Looking at the MOS over time for particular hours of the day, we can see that different Internet providers offer different quality. While others struggle to deliver the same video quality during peak hours, one ISP clearly delivers a better MOS throughout the evening.
MOS over time for different services.
Source: Data from 4.000 crowd users collected in Germany, 2019
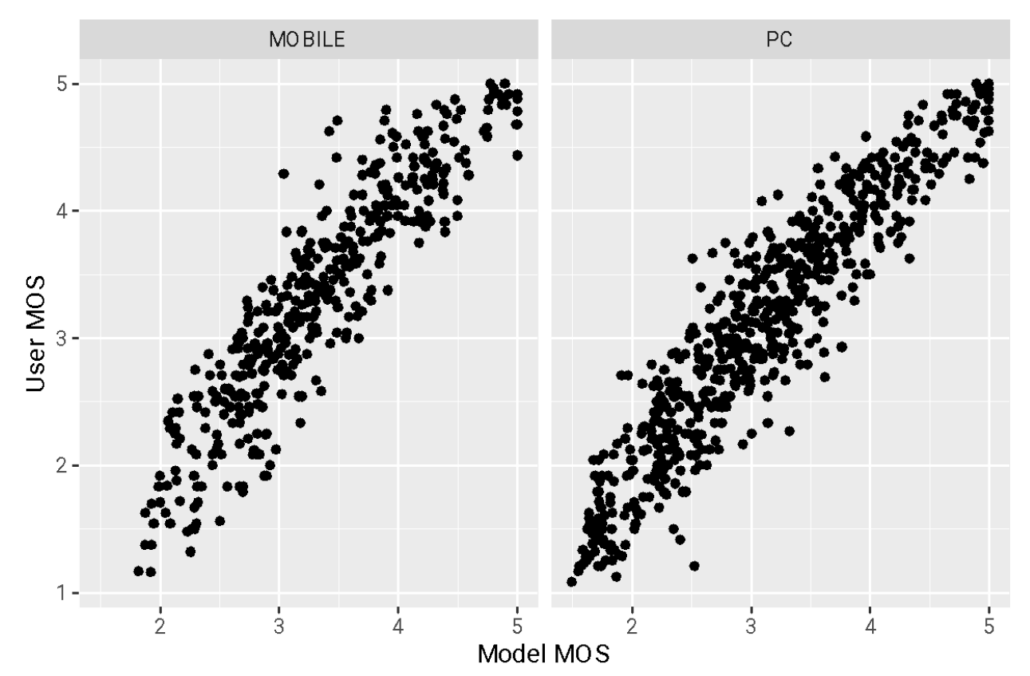
MOS model to real MOS correlation using P.1203
The ITU-T Rec. P.1203 model offers excellent performance when compared against subjective data. With a correlation of up to 0.9, real users’ ratings can be predicted with great accuracy.
Source: Robitza et al., MMSys 2018
Which MOS model to use?
Cover many scenarios with our Surfmeter-based monitoring solution.
There is no single “MOS” algorithm. Different solutions exist to calculate video quality scores. For an accurate estimation of the user-perceived quality, it is important that the MOS algorithm (model) is trained and validated on a large set of sequences using real human ratings as the ground truth.
ITU-T has published a set of recommendations (P.1203, P.1204) which include accurate and reliable video quality models. ITU-standardized models are among the best and most useful since they are:
-
- Specifically created for the HTTP adaptive video streaming use case
- Based on contributions from multiple companies and institutions
- Rigorously tested and independently validated in terms of performance
- Trained on thousands of test sequences using ratings from actual users
- Described openly — no secrets in terms of how the calculation works
Due to our background in standardization, we can offer consulting on and implementations of various ITU-T standards. Just contact us and we’ll find the right model for your use case.
How MOS measurements can help you
There are many reasons our customers rely on our monitoring solutions.
Solutions that help you gather data and calculate video MOS
The products that power the QoS and QoE monitoring solutions.
Surfmeter Lab
Our core technology to drive video and web tests. Any service that runs in a browser — we can measure it.
Surfmeter Automator
Automated measurements – at scale. A powerful automation framework for running Surfmeter measurements on a schedule.
Surfmeter Dashboard
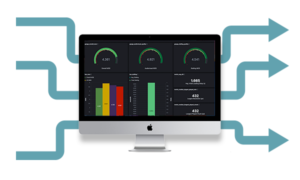
More than just data – our streaming analytics dashboard combines all Surfmeter measurement results.
Contact Us
Let us know your questions regarding video MOS, what models perform best and how to integrate MOS calculation into your streaming setup.
We will find the solution that works best for you.
By contacting us, you agree to receive occasional email updates from us about our products or features.
Capabilities and Supported Technologies
We constantly implement new data sources and visualisation options.
Measurements for video, web and network
Common OTT platforms (see below)
ExoPlayer (HLS and DASH)
DASH.js, hls.js
Web Browsing KPIs (W3C Navigation Timing API)
Speed tests (download, upload, latency)
Network measurements (ICMP ping, DNS, …)
Selected services we support
YouTube
Amazon Prime
Netflix
ARD/ZDF Mediathek
Zattoo
Joyn
… and many more (just ask!)
Dashboard Features
Fully customizable visualizations
Combine filters and graphs in dashboards
User and permissions management
Delegate access to stakeholders
Live data feeds, 24/7
API for import and export of data
Cloud-based service: access directly through your browser
Fully compatible with mobile devices
Integrations and deployment
Add context data from your sources
Ingest additional measurements via API
Perform regular exports for further analysis
On-premise or hosted by us
Fully GDPR-compliant hosting
Secure German datacenter


