How to measure your video platform’s Quality of Experience?

Video streaming is one of the most important online service offerings. It has become ubiquitous. And content is king. We all agree there is a lot of demand for video – high quality video, delivered flawlessly, without interruptions. But how do all these video streaming providers measure up? Do they, do you deliver the quality and customer experience we all want?
Customer experience is important – also for video streaming
Customer experience (CX) and User Experience (UX) have become the focus of effort across industries – from banking and utilities to telecommunications and entertainment. In the video domain, we also talk a lot about Quality of Experience (QoE). QoE focuses on measurable, technical factors, but from a human perspective.
OTT providers and ISPs have great influence. While an Internet service provider can optimize the overall network capacity and peering, an OTT provider like Netflix can control the entire platform, but not the network on which their streams are transmitted.
But key questions remain: Which factor is the most important one for a great QoE? Which technical parameter should be optimized for the desired outcome? And which indicator is crucial to react to, indicating an unhappy customer?
In order to understand how the consumers experience their streams, we need to measure the QoE. Merely measuring the Quality of Service (QoS) on a purely technical basis just doesn’t cut it anymore. And waiting for users to complain is also not a solution. So, how can we measure this Quality of Experience?
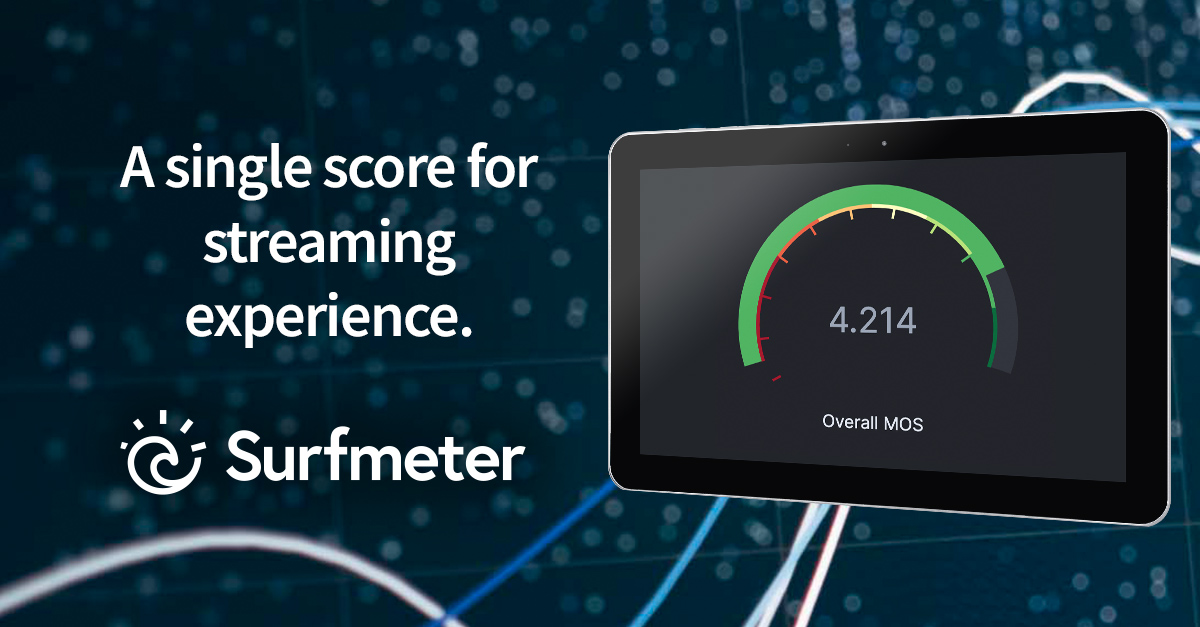
A single score tells you everything about the Quality of Experience
“A single score is enough?” you might ask, and we’d answer with a clear and honest: “Yes!”
Common approaches for video analytics concentrate on an array of technical Key Performance Indicators (KPIs) only. Difficult to interpret, these may be useful for technicians dealing with Quality of Service. However, they do not represent the user’s view. An ideal solution does not only measure these common technical parameters, but also delivers the end-user’s whole impression in a single score: the Mean Opinion Score (MOS). A value of 1 indicates a really bad experience, a value of 5 the best. Easy as that.
Of course there is more to it, so let’s delve deeper.
Client analytics for video streams – and comparisons
From our existing Surfmeter solution, we know that the MOS is valuable for all stakeholders. And it is a great way to quickly make comparisons: compare improved services to older versions, benchmark one ISP’s network against the other, or to see how your video platform measures up against Netflix, Amazon and so on. Having a single score makes it easy to quickly rank the results.
For Surfmeter Client Analytics, we extracted the core asset of our technology into a new analytics product. It is the same technology which has already enabled a large German ISP to discover an overloaded peering-point that wasn’t discovered by common transport monitoring solutions. The reason is simple: our scores can take into account the whole delivery chain, as experienced by the user. If a problem manifests to the user, the MOS will show it. A simple network analysis can’t.
Our tools run comprehensive analytics, and they are based on a state-of-the-art algorithm that has been validated with real customers. Calculating the Mean Opinion Score is basically as good as asking your customers personally – except you can do it on a massive scale.
Other technical data are relevant, too – of course – however, we prefer to use them for the detailed analysis, and not for the general aggregation and pre-filtering. Having the MOS does not mean you cannot drill down into detailed metrics. See the below screenshot for the type of additional data that Client Analytics gives you:
This dashboard was specifically set up for a customer who wanted to quickly see the overall MOS scores but also the amount of stalling happening during playback. The chart in the bottom left shows the average MOS over time, indicating that there were service issues that could later be solved. The bottom right shows the average initial loading delays of the video, with the spike showing possible issues on a particular day.
So, how is Surfmeter Client Analytics deployed?
We built our solution with a focus on simplicity: Just insert it into your own web page and connect it with the <video>-elements you intend to measure.
Surfmeter Client Analytics works with every video service, including yours!
Like all of our Surfmeter products, Client Analytics comes with AVEQ Analytics for data evaluation and the ability to export all recordings to your own databases. It is designed for flexibility: You can add further metadata during the recording or create your own measurement plugins or service adapters. It runs on multiple platforms and is compatible with all variants of Google Chrome, Mozilla Firefox, Microsoft Edge and Apple Safari.
Interested in measuring Quality of Experience?
If you have any questions regarding Surfmeter Client Analytics, Quality of Experience or the automatically calculated Mean Opinion Score, we are happy to go into more detail. Feel free to contact us or book a demo of our tools.
Follow us on LinkedIn for updates on the world of video streaming and QoE!


