Measuring the Quality of Cloud Gaming

Cloud gaming one of the latest trends in the entertainment industry — customers can gain access to a plethora of game content without needing to buy specialized hardware. Services like NVIDIA’s GeForce Now, Google’s Stadia or Sony’s PlayStation Now render the game at the server side and simply transmit a video stream to the end device. The user sees just a video, but it feels like playing a real game on their end device.
Both cloud gaming providers and Internet Service Providers strive to offer the best experience to their customers, yet the customers often don’t know from where service issues originate. This is why recently an ISP approached AVEQ to deliver a solution to measure the quality of cloud gaming on their networks.
In this article, we’ll briefly describe the requirements for quality measurements, and dive deeper into what we implemented.
Measuring gaming quality with AVEQ’s Surfmeter tool
How do cloud gaming services compare? How do they perform under different network conditions? In order to find out, we developed a solution together with the ISP customer. It was important to our stakeholders to not only measure bandwidth and latency (more on that later), but also calculate a quality score that could be used to evaluate different cloud gaming services on different networks. This score — the Mean Opinion Score (MOS) — should reflect how customers would rate their gaming experience.
Furthermore, our solution should run both on the actual end device (an Android phone) as well as network-centric monitoring probes that can later be used to automatically measure the quality of all cloud games running on the ISP’s network. So we had to make sure to implement something platform-independent.
What factors impact the quality of cloud gaming?
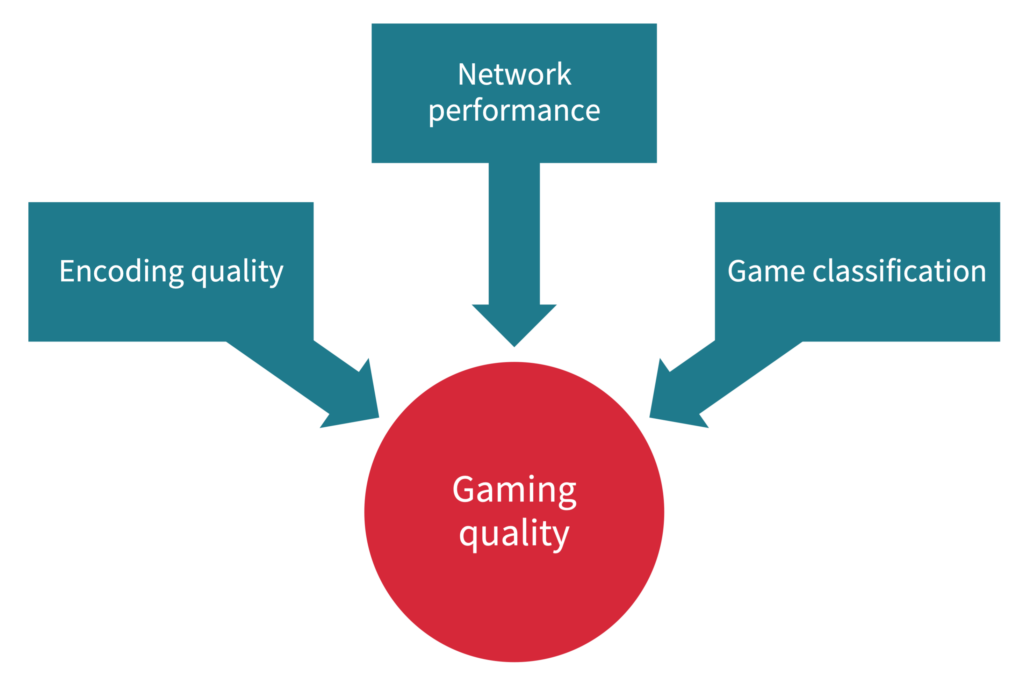
The quality of cloud gaming is extremely dependent on three factors, among others: the encoding at the server side, the network conditions during transmission, and the type of game being played.

In terms of encoding, cloud gaming providers use extremely fast encoders that deliver video within milliseconds of being rendered by the gaming engine. They do that at the cost of higher bandwidth utilization and, possibly, lower video quality.
As for network conditions, limited bandwidth will result in noticeable quality degradation in terms of blurry video, or even frozen streams. Stadia, for instance, requires at least 10 MBit/s for 720p video resolution — a bandwidth that is not even available in many places that still depend on DSL. Bandwidths up to 45 MBit/s may be necessary to get a full 4K, HDR stream delivered.
The latency (i.e., a high ping) will even further impact the user experience: if the latency is too high, or if it fluctuates too much (jitter), the game will feel unresponsive, and the user might quit playing out of frustration.
The latency requirements depend on the type/classification of the game. For example, shooter games will have much stricter requirements compared to puzzle games. Latencies between 0 and 20 ms are optimal; latencies above 50 ms will be noticeable, and anything beyond 75 ms might make the game unplayable.
What did we develop?
We developed a custom C++-based network monitor that can detect traffic from selected cloud gaming applications using the PCAP libraries.
We spent a lot of time dissecting the involved transmission protocols so that we could determine what was being transmitted, and derive the game performance and quality from the data. Our monitor was built for a gaming application available to millions of the ISP’s customers, but it can be extended for any possible game or video stream. It generates periodic reports on the most important audio/video key performance indicators, as well as other metadata. Also, we’re able to calculate a quality of experience score — we’ll get into that below.
Our network monitor processes incoming packets in threads, and it adds them to processing queues, which are run in the background. This way, the performance of the main gaming application is not affected, even if it runs on the same mobile device.We deployed our network monitor as a native module within our existing Surfmeter Mobile app. That allowed us to not only measure the gaming performance and quality, but also gather info on the current mobile or WiFi network conditions as well as the geolocation of the device. This would become useful later while testing the cloud gaming services under different scenarios.
Quality of Experience for cloud gaming
How can you calculate a score for a gaming session that reflects what the user would think?
For this, we have Quality of Experience (QoE) models. These models take various parameters as input and output a Mean Opinion Score (MOS), often on a scale from 1–5, where 1 is bad and 5 is excellent. Such models were trained on actual human ratings, but they can later be used just on the stream data, without requiring human ratings.
Measuring the quality of the video stream is not easy if you cannot decrypt it — be it for legal or performance reasons. That is why we chose the ITU-T Rec. G.1072 opinion model for gaming. It is called “opinion model” because it helps providers determine — even before setting up services or networks — how many resources they need to provision in order to deliver a certain amount of quality. It also doesn’t require decoding the video stream.
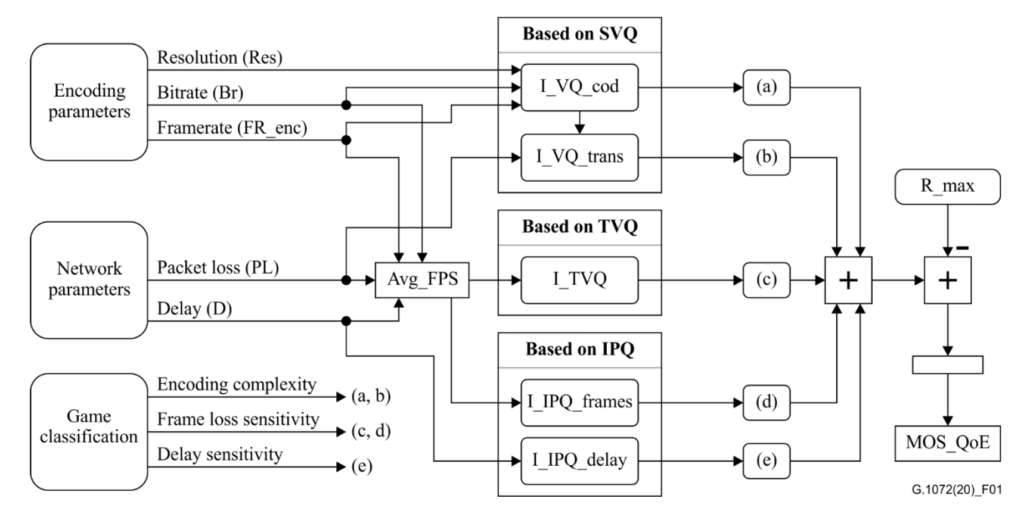
The below figure shows how different factors are taken into account when calculating the final QoE value. This looks quite complex, since it models the human perception of quality.

G.1072 uses the factors that we mentioned above (like video codec and bitrate, packet loss, latency and game type) to determine the MOS value. The game type determines the complexity of the interaction; higher complexity games will have less tolerance for high latency. For the current measurements we did, we manually set the game type, but this might be automatically determined in the future.
Here’s an example of what G.1072 would predict for two types of conditions:
| Parameter | Measurement 1 | Measurement 2 |
| Video bitrate | 2 MBit/s | 50 MBit/s |
| Video resolution | 640×380 | 1920×1080 |
| Framerate | 25 | 60 |
| Packet loss | 0.5% | 0.2% |
| Delay | 200 ms | 20 ms |
| MOS | 1.45 | 4.12 |
Surfmeter measurement results
With our solution, we could easily collect all measured data in a central Elasticsearch cluster. The data can be shown in Kibana using the dashboard feature, allowing our customer to simply create the visualizations they need to measure the performance and quality of the gaming solutions.
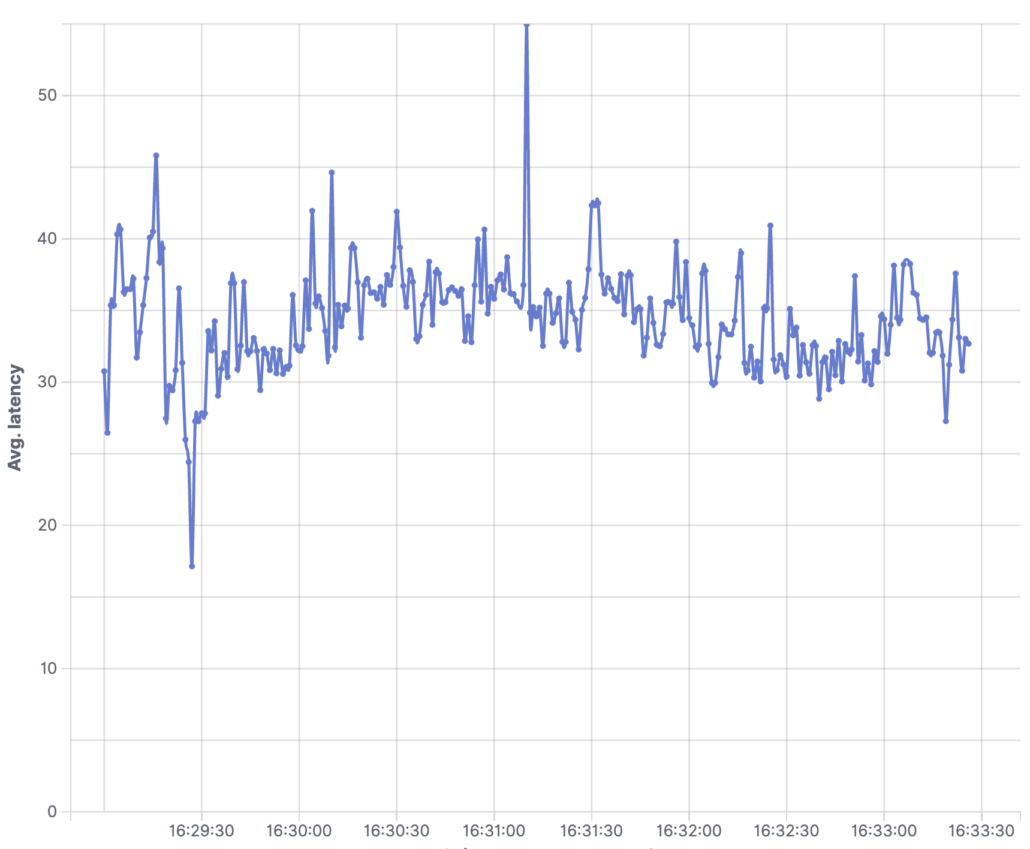
Below you see measurements performed on an Android end device, streaming a game over the course of several minutes.

We can observe latencies hovering mostly between 30 and 40 ms, with occasional spikes of 50 ms and more. This is quite good already, but the spikes could impact the responsiveness of the game.As you can see, it’s fairly straightforward to measure the parameters that affect user experience and quality for cloud gaming. At AVEQ, we’re constantly adapting our core video quality and network measurement technologies for new types of services.
Get in touch with us if you have any questions about measuring gaming QoE!


