How Oxyfi Optimizes Rail Connectivity with Surfmeter’s Standardized QoE Measurement
Having free WiFi on the train is great, except when it doesn’t work. While that means you get to look out the window and enjoy the breathtaking views, your work/your Netflix movie will stall.
We’ve come to learn that in the rail industry, traditional network KPIs (like signal strength, bandwidth, loss, jitter etc) often fail to reflect the actual passenger experience. So how can train operators understand the level of experience of their passengers? Since 2025, Oxyfi, a leading provider of managed train connectivity, has partnered with AVEQ to implement a robust Quality of Experience (QoE) measurement framework.
In 2024 Oxyfi installed a Starlink Satellite data link on a train in northern Sweden to complement their existing OxBox dual 5G robust high performance connectivity solution. As pioneers in multi-backhaul rail connectivity, Oxyfi integrated Starlink satellite links to operate alongside their robust OxBox multi-5G platform. To analyze the advanced hybrid network, Oxyfi needed a tool to evaluate how it translated into actual passenger value.
While evaluating the quality gains, they soon realized that they needed more than just the standard network parameters like signal strength, bandwidth, jitter, loss, round trip time etc to fairly assess the quality gains.
Connectivity on trains is a complex system with many different hardware and software components. It is not enough to measure a few components or aspects of a complex system to fairly assess its delivered quality. Instead the system as a whole should be tested, from the user perspective. Only by assessing the perceived quality of the services that passengers typically use onboard, i.e. surfing, Netflix, Youtube, Microsoft Teams and Google Meets etc, can a fair picture of the perceived quality be derived.
By deploying AVEQ’s Surfmeter technology, Oxyfi has moved beyond basic telemetry to understanding how services like YouTube, Netflix, and Microsoft Teams actually perform in the volatile environment of a moving train.
Traditional network telemetry data are not always great at estimating the true quality of the passenger experience for on-board WiFi. While signal strength and raw bandwidth provide a baseline, they do not account for the nuances of video streaming or real-time communication on a moving train, where network conditions may change rapidly To bridge this gap, Oxyfi has deployed Surfmeter as an advanced Quality of Experience (QoE) measurement tool. This means that connected trains can provide a data-driven view of the network quality — or rather of the actual quality as users would perceive it.
The project moves beyond QoS and uptime metrics toward application-layer benchmarking. By utilizing AVEQ’s measurement tools, Oxyfi is able to simulate actual user behavior for high-demand services such as YouTube, Netflix, Google Meet and Microsoft Teams. This approach allows Oxyfi to identify specific performance bottlenecks — such as the impact of signal loss in tunnels or the latency introduced by missing DNS caching.
Standardized Testing with Surfmeter by AVEQ
The technical foundation of this initiative is Surfmeter, AVEQ’s specialized solution for automated QoE assessment. Surfmeter utilizes headless browser instances to interact with streaming and web services exactly as a passenger would. This allows for the collection of high-fidelity data, including initial loading times, stalling events, and resolution/bitrate changes for video, or page load times for web browsing.
Surfmeter translates these complex technical variables into a standardized Mean Opinion Score (MOS) based on international standards such as ITU-T P.1203. This is critical for Oxyfi, as it provides an objective benchmark that can be used to compare their service levels against competitors. Furthermore, Surfmeter’s flexibility allows it to be deployed either as dedicated hardware probes for deep-dive lab-style testing or as lightweight Docker containers integrated directly into a train’s existing routing hardware, such as Oxyfi’s powerful OxBox platform with native support for edge container computing.
Technical Implementation and Operational Impact
Throughout the deployment, the partnership has addressed several unique rail-specific challenges. To measure the capacity of aggregated links, the team implemented parallel testing schedules for speed and throughput tests, ensuring that measurements reflect the total throughput available to the entire train rather than a single user. For real-time communication, the project utilizes a dual-probe configuration to simulate end-to-end conferencing scenarios, measuring the jitter and latency inherent in satellite or cellular backhaul.
Key Testing Parameters:
- Video Streaming: YouTube and Netflix with KPIs for Mean Opinion Score, stalling, initial loading times, and bitrate transitions
- Conferencing: End-to-end Microsoft Teams and Google Meet tests
- Parallel Throughput: synchronized speed tests to determine the maximum capacity of aggregated train links
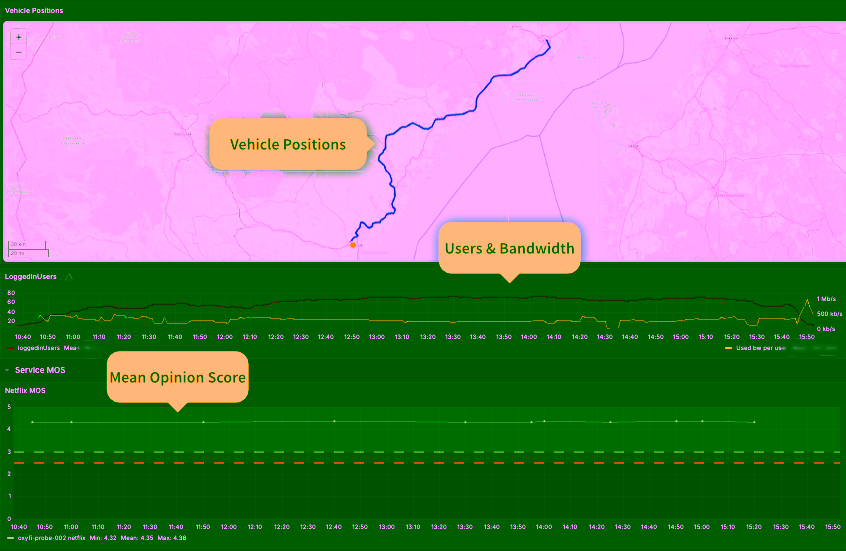
- Metadata Integration: Correlating network performance with geographical data (GPS), signal strength and passenger counts for an integrated map view.
The data generated by these tests has led to immediate operational refinements. Early measurements identified that implementing DNS caching could significantly reduce web-browsing latency, a “low-hanging fruit” that improved the overall user experience without requiring massive infrastructure changes.
Additionally, the system’s ability to capture screen recordings allows engineers to visually verify what would happen to an actual customer.
Oxyfi points out that train owners and operators make large investments in train connectivity while making little to no efforts to evaluate the delivered quality in daily operations throughout the lifespan of the investment. And the efforts that are made often use tools provided by the connectivity supplier.
One major reason behind the reluctance to independently evaluate the quality is that it is hard to fairly assess it. Or at least it used to be hard. Now, with Surfmeter, it is easy to make supplier independent quality evaluations.
“We can finally map our technical optimizations directly to the passenger experience,” says Filip Rosenbaum, CTO at Oxyfi. “Before, like everyone else in the industry, we had to rely on network-layer metrics. Now, Surfmeter gives us and our clients an undeniable, application-layer proof of performance.”
Future Outlook for On-board QoE Measurements
With Oxyfi, we are working on scaling the project toward a larger rollout across more trains. The resulting datasets provide Oxyfi with the evidence for their excellent performance and allow them to optimize for end-user Quality of Experience.
By integrating geographical and signal metadata with real-world application performance and QoE, Oxyfi and AVEQ are establishing a new standard for how connectivity is measured and managed in the rail industry.
If you are interested in measuring the quality of onboard connectivity for trains, planes or ships, reach out via hello@aveq.info or our contact page.

