The OSI Model in Practice: How Surfmeter Measures the End-User Layer
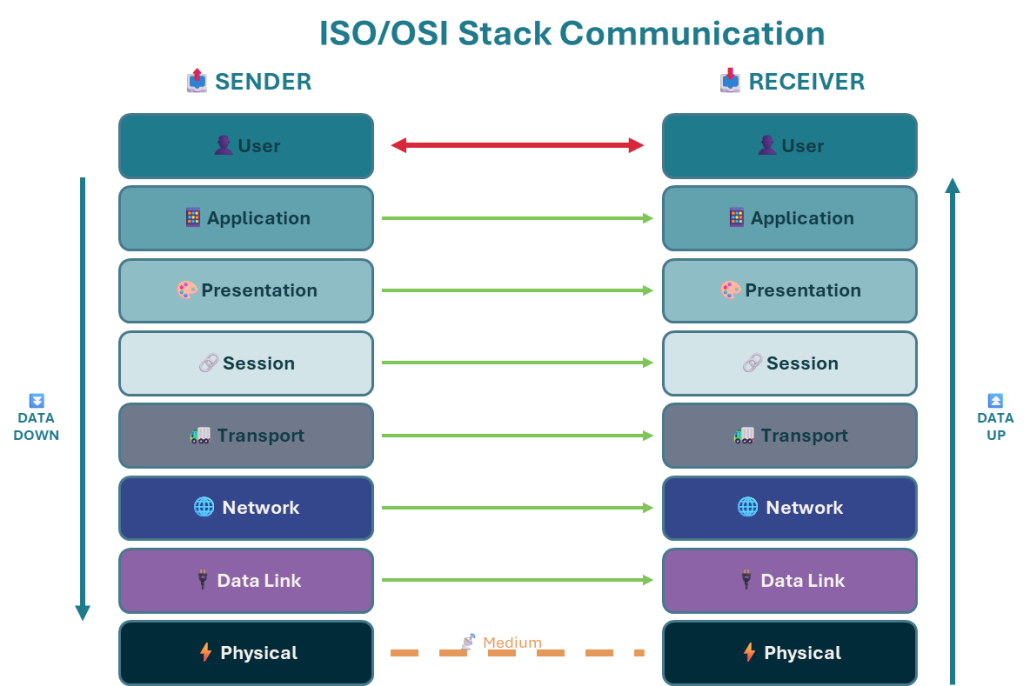
The ISO/OSI model is the invisible backbone of our daily internet use. It’s an abstract framework that organizes the complex process of digital communication into seven distinct layers: Physical, Data Link, Network, Transport, Session, Presentation, and Application. However, the complexity of this stack leads to two important issues when it comes to measuring end-user experience:
- Many network measurement tools focus on metrics from a single layer, providing only a partial view – measuring or optimizing one layer in isolation doesn’t guarantee a better overall user experience. In other words: problems experienced by users often stem from complex interactions between these layers.
- The highest ISO/OSI layer still does not tell you what the user really experienced. While it gives you important information about what was transmitted on the network, knowing what happened on the screen is the most crucial aspect for the final Quality of Experience.
At AVEQ, our Surfmeter platform is built on a cross-layer measurement methodology. This means Surfmeter doesn’t just look at one piece of the puzzle; it analyzes how the different layers work together to deliver services to your end-users
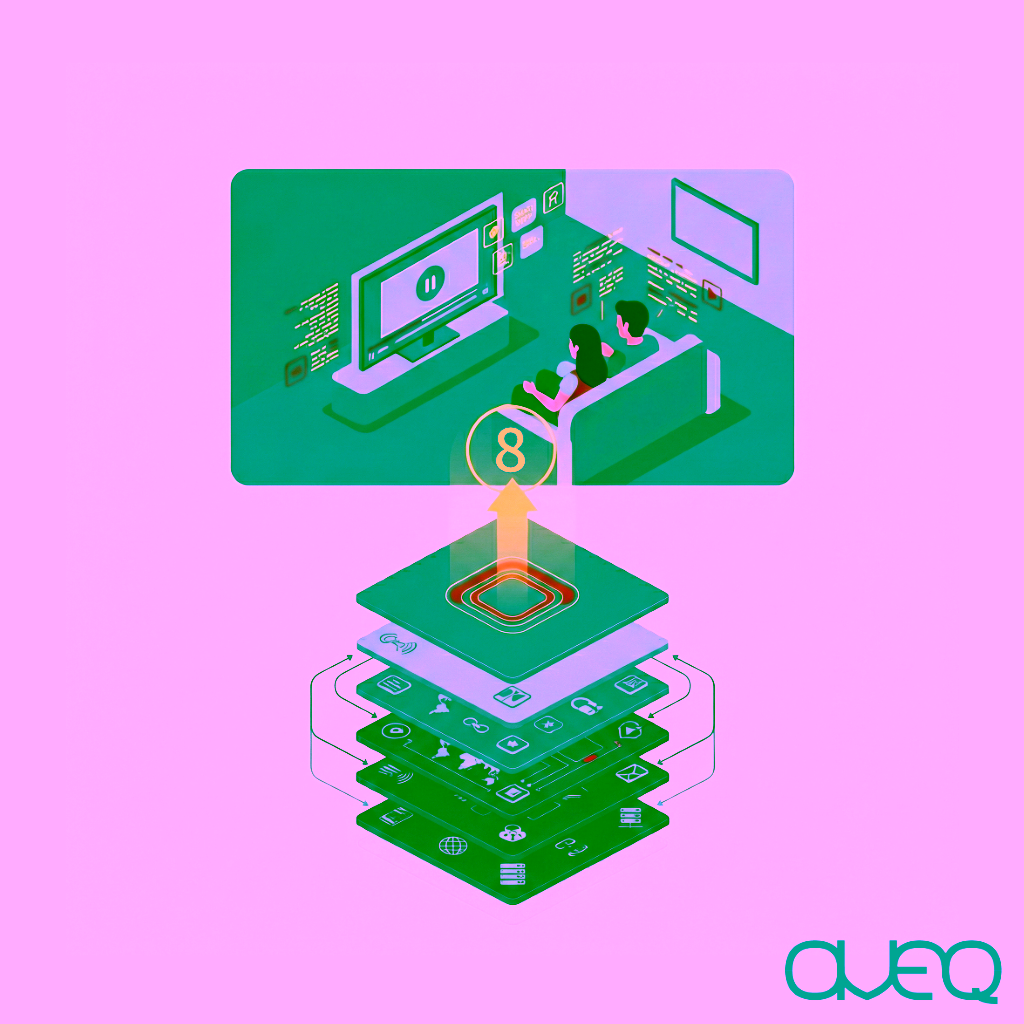
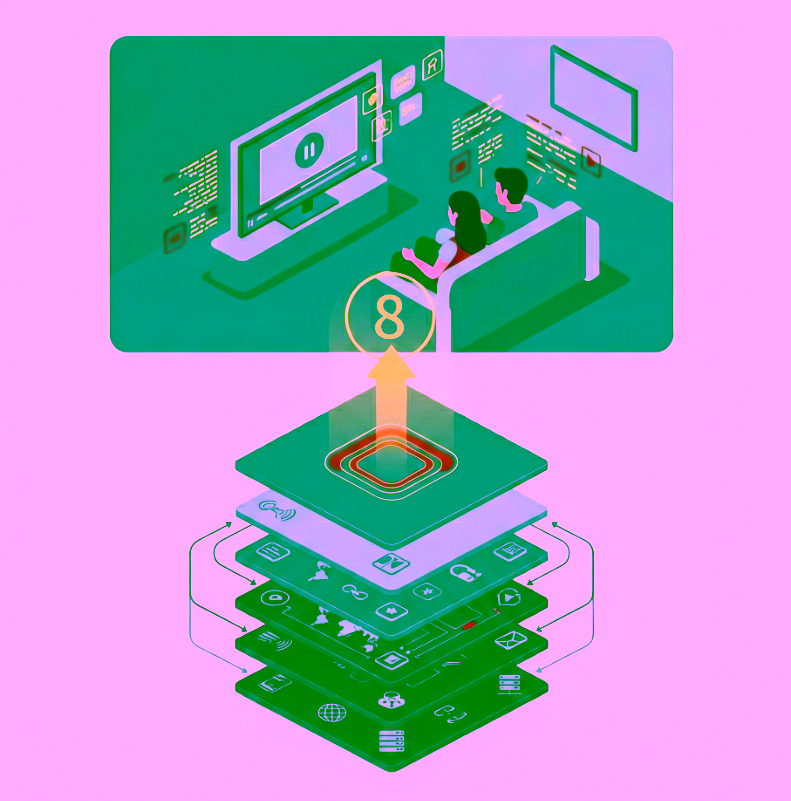
And while over the course of time some layers have become less important, there is something new on the horizon: Layer 8 – the end-user layer. This is where the actual customer experience happens. In the current research discussions, Layer 8 is becoming increasingly talked about, even though there is no standardized definition of that yet.
Stakeholders across the entertainment and networking industries realize that this holistic approach is crucial for truly understanding and improving Quality of Experience (QoE). Let’s explore this top-most layer in conjunction with the ISO/OSI layers to see why this matters.
The 8 ISO/OSI Layers Explained
Layer 8: The End-User – What Really Matters
- What this layer does: This is you, sitting in front of your computer or TV, trying to binge the newest series on your favorite streaming platform. It’s not an “official” layer in the ISO/OSI stack, but what ultimately matters is what you see on screen. Whether it’s slow video startup times or rebuffering events, or inefficient audio/video codecs — these are important for the QoE.
- Traditional Measurements: They just don’t exist in this context, at least from a network perspective. While some measurement tools try to capture what people experience on their screens, they are typically realized as screen recordings (e.g., pointing a camera at a TV), which suffer from inaccuracies and complicated setups that cannot be scaled easily, or they simply don’t work due to DRM issues.
- Surfmeter’s Perspective: With Surfmeter, we tap into the APIs that are the bridge between the application itself (e.g., the video player) and the user’s own eyes. We measure exactly what happens in a video player, and how that relates to what you are seeing. These are the crucial aspects when it comes to quantifying the Quality of Experience. In particular, Surfmeter understands media. It analyzes aspects of the video stream itself, such as resolution, bitrate, and codec used. This allows it to correlate network performance with the actual visual and auditory quality being delivered, providing a direct link between network conditions and the user’s perceived experience. It sees inside the “black box.
Layer 7: Application Layer – Where the User Meets the Network
- What it does: This layer provides the interface for applications to access network services. This is where familiar protocols like HTTP/HTTPS (for web browsing) or DNS (for name resolution) operate.
- Traditional Measurements: Include DNS lookup times, HTTP GET/POST request times, or basic API availability checks.
- The Limitation for QoE: Modern web applications and streaming services are incredibly complex, using HTTP/2 or HTTP/3 for multiplexing, adaptive bitrate streaming (ABR) algorithms inside the video players that decide when to place network requests, and different Content Delivery Networks (CDNs) that respond to the requests. Measuring a simple HTTP response time or DNS lookup doesn’t capture the nuances of how the application really behaves. A fast network doesn’t mean a slow application (due to bad code or slow servers) will be fast. And, importantly, just measuring application traffic does not tell you what is happening inside the player — is it rebuffering or not? You can only know by measuring what the end-user sees!
- Surfmeter’s Application Layer: Surfmeter operates by performing real user interactions at Layer 8 and inspecting them at the application layer, e.g. to record individual HTTP requests and responses. This provides direct QoE metrics that matter to users and service providers alike in conjunction with data that tells you why a problem occurred.
Layer 6: Presentation Layer – Translating the Data
- What it does: Ensures that data is in a usable format for the applications. This includes data translation (e.g., character encoding like ASCII to Unicode), encryption/decryption (like TLS/SSL), and compression.
- Traditional Measurements: Might look at TLS handshake times or identify encryption protocols. Most network tools treat the actual data payload (like the video itself) as a “black box” and cannot go beyond TLS encryption.
- The Limitation for QoE: Capturing TLS traffic itself does not tell much about the quality of the content transmitted. While there have been some efforts to use Machine Learning approaches to predict the QoE of applications based on encrypted data alone, this approach is very limited due to it being dependent on the service under study — and service changes over time may invalidate such measurements very quickly.
- Surfmeter’s Unique Capability: Surfmeter understands media by analyzing it at higher layers. It analyzes aspects of the video stream itself, such as resolution, bitrate, and codec used, which are not available from Layer 6 alone. We can therefore see inside the “black box.”
Layer 5: Session Layer – Managing the Conversation
- What it does: Establishes, manages, and terminates connections (sessions) between applications. The functions traditionally assigned to the session layer — such as managing sessions, dialogs, and state between applications, including things like checkpointing, recovery, and synchronization—are either embedded within application protocols themselves (e.g., HTTP, FTP, SMB) or handled by frameworks and libraries within applications.
- What to take from it: While the concepts of the session layer still exist and are important, especially in contexts like streaming or persistent connections, there is rarely a direct, standardized protocol or component labeled as “Session Layer” in modern stacks. We instead measure these aspects directly through layer 7.
Layer 4: Transport Layer
- What it does: This layer provides reliable or best-effort data transfer from an application on one device to an application on another. Key protocols here are TCP (guarantees delivery, manages flow and congestion) and UDP (faster, no guarantees — good for streaming or gaming). QUIC has also recently become more widespread, and it is based on multiplexed UDP.
- Traditional Measurements: Typically focus on TCP throughput tests and packet retransmissions. For UDP, packet loss rates and jitter are often commonly tested.
- The Limitation for QoE: Standard TCP throughput tests might show high available bandwidth, but don’t reveal how TCP’s complex algorithms interact with specific applications or varying network conditions. Metrics like packet loss are important, but don’t directly translate to the impact on the application layer. The rise of QUIC, which bundles transport and some security functions, further blurs these lines, making single-protocol tests less representative.
- Surfmeter’s Insight: While Surfmeter offers TCP-based throughput tests in its standard test suite, it also analyzes how the choice and behavior of transport protocols (TCP, UDP, QUIC) directly influence application performance. For video, it sees how TCP congestion control might affect buffer fill rates and rebuffering events. This is extremely important for special networks like Internet over satellite, where typical assumptions about TCP do not hold.
Layer 3: Network Layer – Charting the Course Across Networks
- What it does: This layer is responsible where the IP protocol sits. It performs logical addressing (IP addresses) and routing packets across multiple interconnected networks to their final destination. Think of it as the internet’s postal service, figuring out the best path for your data.
- Traditional Measurements: Often rely on ICMP-based tests like “ping” to measure basic connectivity and latency, or traceroutes to map paths across IP-based networks.
- The Limitation for QoE: Ping tests only tell you if a server is reachable and the round-trip time for a tiny packet. Packet losses may indicate a problem, but it’s unclear how they manifest to the users. IP-based tests don’t reflect the actual performance of complex applications like video streaming or large file downloads, which use different protocols and are affected by factors beyond simple latency.
- Surfmeter’s Difference: Surfmeter goes far beyond ping. It measures the performance of actual application traffic (e.g., a YouTube stream) as it traverses various networks. This shows how routing, network congestion, and QoS policies truly impact the service quality delivered to the user, providing a much richer picture. Furthermore, Surfmeter allows you to conduct additional tests (Traceroute tests or ICMP ping tests) in conjunction with the video streaming quality measurements, so you have the information from both layers readily available.
Layer 2: Data Link Layer – Reliable Local Delivery
- What it does: Manages data transfer between two directly connected nodes (e.g., your computer and your Wi-Fi router). It takes raw bits from Layer 1, groups them into “frames,” handles error detection and correction (like CRC checks), and controls access to the physical medium (e.g., Wi-Fi’s CSMA/CA to prevent data collisions).
- Traditional Measurements: Often report raw data rates of the link.
- The Limitation for QoE: These raw rates don’t account for the overhead of error correction, retransmissions, or access protocols, especially in congested Wi-Fi environments. This leads to an overly optimistic view of actual throughput available to applications.
- Surfmeter’s Advantage: Surfmeter understands that the effective throughput at the application level is what matters. While not directly measuring Layer 2 efficiency, its end-to-end measurements implicitly capture the impact of Data Link layer inefficiencies (like Wi-Fi congestion) on services experienced at the application layer.
Layer 1: Physical Layer – The Foundation
- What it does: Transmits raw data bits (the zeros and ones) as electronic, optical, or radio signals over a physical medium (cables, fiber, airwaves). It’s all about the fundamental hardware – connectors, cable specifications, PCB-design, signal voltages, and frequencies.
- Traditional Measurements: Focus on signal strength, bit error rates, and raw transmission capacity.
- The Limitation for QoE: Essential for basic connectivity, but good signal quality alone doesn’t guarantee a smooth video stream or a fast-loading webpage. A perfect signal means nothing if higher layers are congested or misconfigured.
- Surfmeter’s Perspective: Surfmeter acknowledges the importance of this layer but understands that user experience is built far higher up. Its analysis begins where real user interactions happen, correlating application performance back to the underlying network capabilities, including those rooted here.
How Surfmeter Delivers the Full Picture – Beyond Traditional Tools
As we have seen above, traditional network measurement tools often work in silos by measuring at one specific layer. One tool pings for ICMP latency at the IP layer, another tests TCP throughput at the transport layer, and perhaps a third checks DNS resolution at the application layer.
Each check may provide a piece of data, but this fragmented approach fails to capture the complex interplay between the layers that dictates the actual Quality of Experience for users as it manifests in Layer 8.
In today’s competitive digital landscape, where user expectations are constantly rising, simply having a “fast” network isn’t enough. Providers need to deliver a consistently high-quality experience. Surfmeter’s cross-layer visibility provides the comprehensive insights necessary to achieve precisely that, offering the full picture where others only show fragments.
Discover how AVEQ Surfmeter’s cross-layer methodology can provide the actionable insights you need. Contact us today for a consultation on how we can help you optimize your network for true user satisfaction.

