
The “Evolution” of the Netflix ISP Speed Index
If you head to https://ispspeedindex.netflix.net/ you can see Netflix listing all ISPs and their speeds — broken down by country. If you haven’t seen it yet, it’s worth visiting the page for your country. This article first appeared on LinkedIn.
From my time working at a Tier 1 telco, I distinctly remember the Netflix ISP speed index as something people would carefully look at in terms of where the ISP was positioned against competitors — because it could impact customers’ choices.
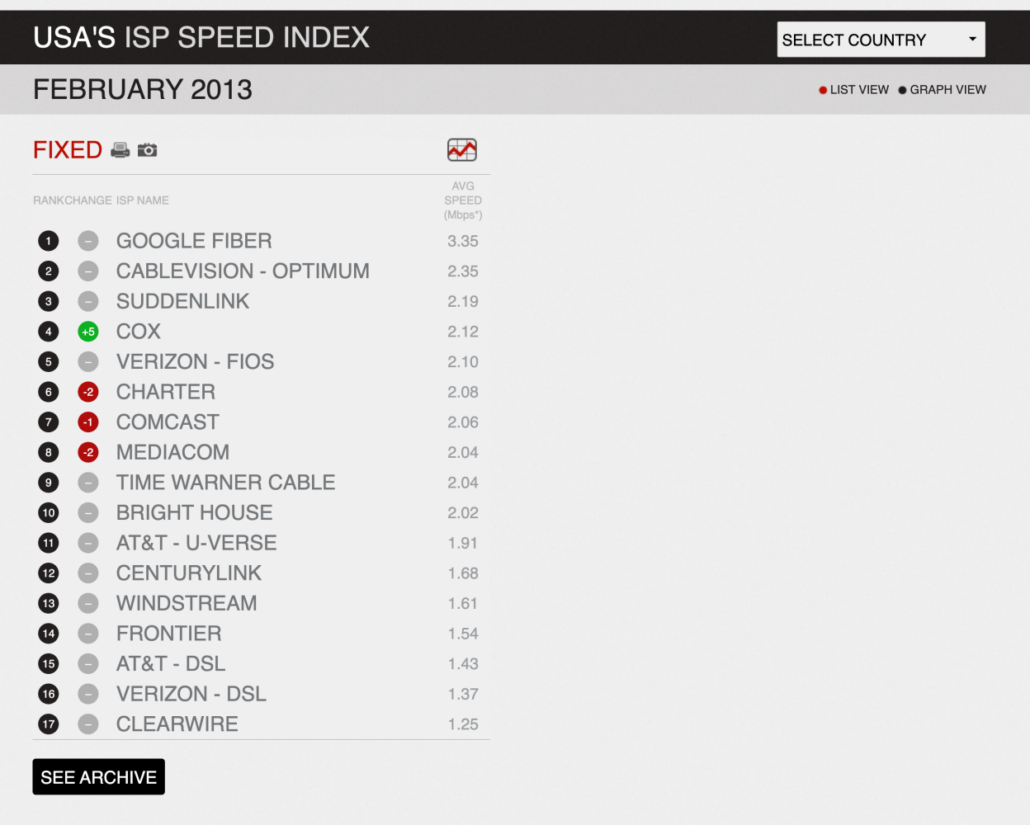
For most of the years, Netflix would show detailed average download speeds for prime time views, and rankings based on that speed. Here’s the very first publicly available speed index for the USA that I could find on the Wayback Archive — from 2013:
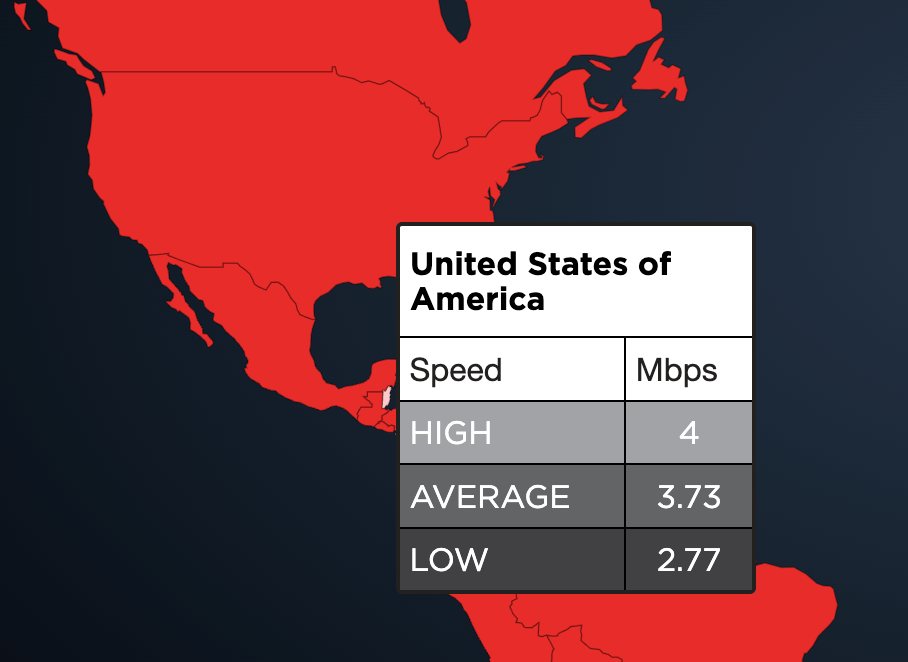
Later, the page was updated to provide an even simpler global overview, with a map of each country in which you could stream Netflix, and a Low/Average/High popover on the map itself. This is from 2018:
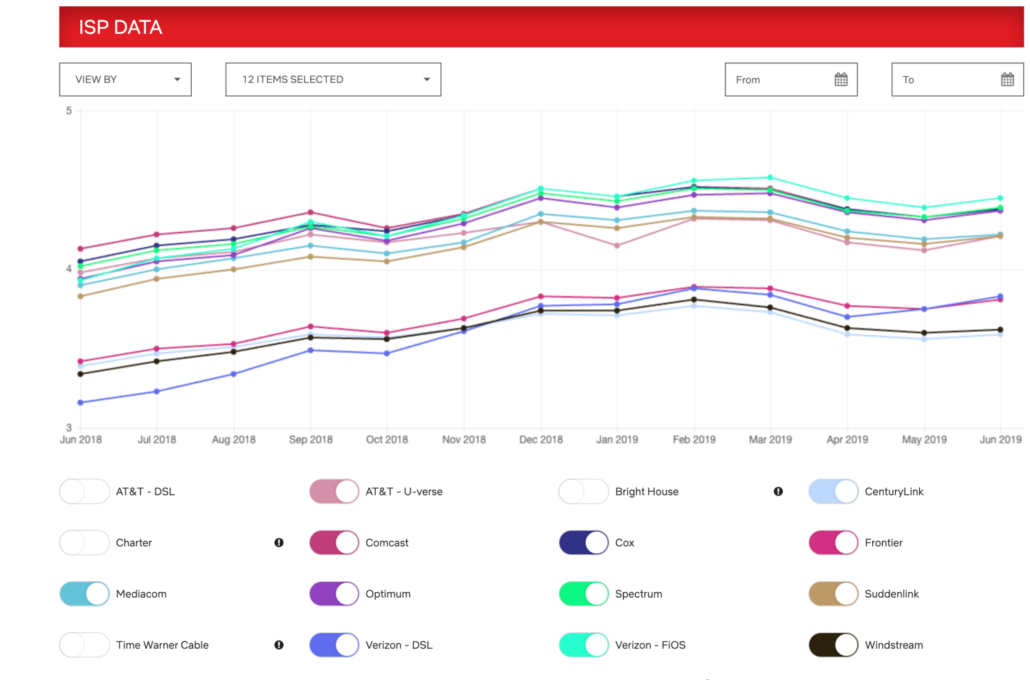
They even let you see the data over time and directly compare ISPs — this was available from the beginning:
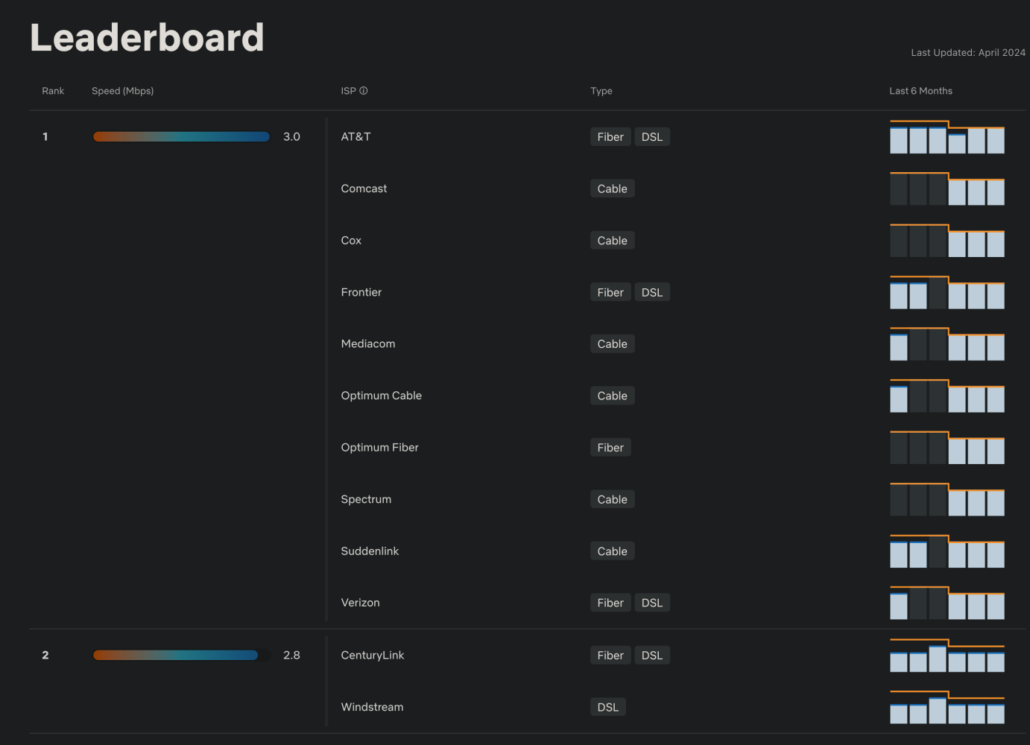
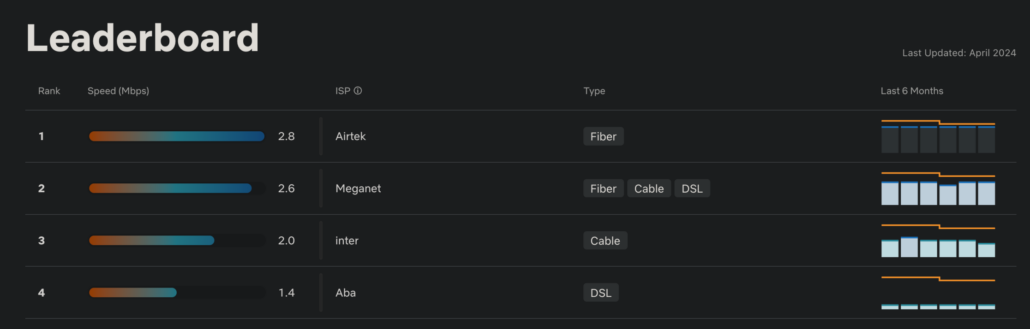
However, today, this index looks quite different. It is now a leaderboard with most ISPs sharing their ranks, grouped into buckets of speed rather than the actual speed they obtained. While in the beginning, you could see detailed statistics and even rankings over time, this is now a much more simple overview. I don’t know when this was changed — my research points to some time in early 2021. I am curious as to why these changes were made.
Apart from not showing detailed averages anymore, Netflix has changed their scoring algorithm. The scores no longer reflect the actual throughput rates, but time-weighted performance scores based on the maximum achievable bitrate. The score is then normalized globally based on the number of hours streamed in each bucket.
This leads to a situation in which — for example in the USA — almost all providers share the same rank. They are now just listed alphabetically.
As an end-user, I can no longer meaningfully compare these ISPs. They all look the same to me in terms of performance. What new information am I supposed to get from this page? In a way, they’ve made the results less useful for customers. Or have they?
Looking at it from a different angle, you might say that all these ISPs are equally good. Look at these average rates: A sustained throughput of 3 MBit/s is not hard to accomplish in today’s world, even with DSL. Maybe Netflix wants to tell us that we can all just relax and enjoy their offering without having to worry about which ISP they choose.
Granted, there are some regions like Venezuela where there is a clear difference among providers:
This is very likely due to the general state of the infrastructure in a country. But globally, everything seems to be … just fine? I suppose we don’t need to care about averages of 2.19 vs 2.12 MBit/s.
The fact that we do not have to worry about throughput anymore is of course also due to the evolution of HTTP Adaptive Streaming algorithms. We can now stream with much more confidence, as playout algorithms have become more resilient against buffer underruns, and video encoding with newer codec generations has become cheaper and better in terms of bitrate/quality tradeoffs. In fact, the global averages haven’t changed all that much over the years. But with video codecs like HEVC and AV1 becoming significantly more efficient (and being actually deployed), this means quality has become even better — and maybe there is just less to worry about.
That doesn’t mean you can’t compare ISPs when it comes to OTT quality. But don’t just do it based on throughput alone. As I frequently say, streaming quality is not linearly related to available bandwidth, and there are many other factors that can impact a user’s satisfaction with an OTT service. These range from the actual page load time to frequent streaming interruptions (stallings/rebufferings) or unoptimized bitrate ladders that affect overall visual quality. To provide a ranking meaningful for end-users, a metric like a Mean Opinion Score (MOS) could help bring together these factors in a single number, as long as that metric factors in all these possible distortions.
In any case, perhaps these leaderboards are not driving consumer decisions as much as they did back when streaming apps were still hungry for scarce resources like … more than a few Megabits per second. And so Netflix decided to create a more high-level overview (the original data is still available anyway). Let’s not forget factors like content availability, pricing, and bundling options.
What do you think of these kinds of leaderboards? Do you know more about why these changed over time, or do you have other examples of public ISP scoring efforts based on app quality?
PS: There’s one last catch: as Netflix writes, “the ISP Speed Index reports on home broadband networks” — so it leaves out mobile streaming completely. I am sure that we would see a lot more variation in the data rates, as coverage maps significantly influence the overall results. From my last time trying to watch a Netflix movie on a train in Germany, I was painfully reminded of how bad mobile connections can still be. I wonder if we’re ever going to see a mobile operator comparison, or whether we have to rely on plain speed test results to give us insights into mobile network performance? I am not convinced that running a simple speed test is enough to tell you about OTT app quality. But more on that in another post.

