How to measure Video QoS and QoE with Surfmeter
Almost everyone knows the most important Key Performance Indicators for video streaming: the time it takes for the video to start, and whether there are any interruptions during playback. You also typically want to know the resolutions that your client receives. However, there are many more indicators that are relevant for determining the overall quality of your streaming service – and ideally you could see the quality reflected in one simple number.
In this post we‘d like to show you how you can leverage our Surfmeter solution to measure video KPIs and Quality of Service (QoS), but also how to use the concept of Quality of Experience (QoE) to find out how a customer would experience a video stream.
Simply measure and view video KPIs
With Surfmeter, you can easily measure and visualize the most important metrics for video streaming. We‘ve made it simple to stream any video of your choosing, and then immediately show the performance results.
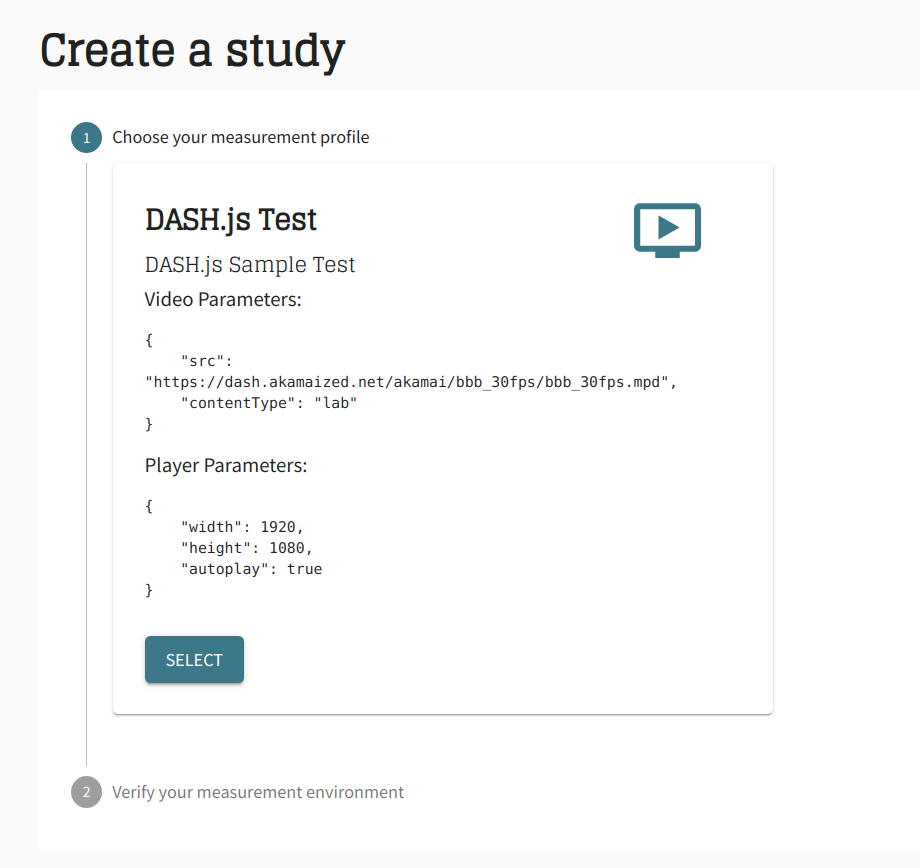
Let‘s look at the measurement on our desktop solution. Here, we‘ve selected a DASH playback of an Akamai-hosted video, Big Buck Bunny, through the dash.js player. The measurement will take one minute to get an estimate of the stream‘s stability, including buffer behavior. We can of course select other services and other durations depending on the measurement scenario adapted to your requirements.
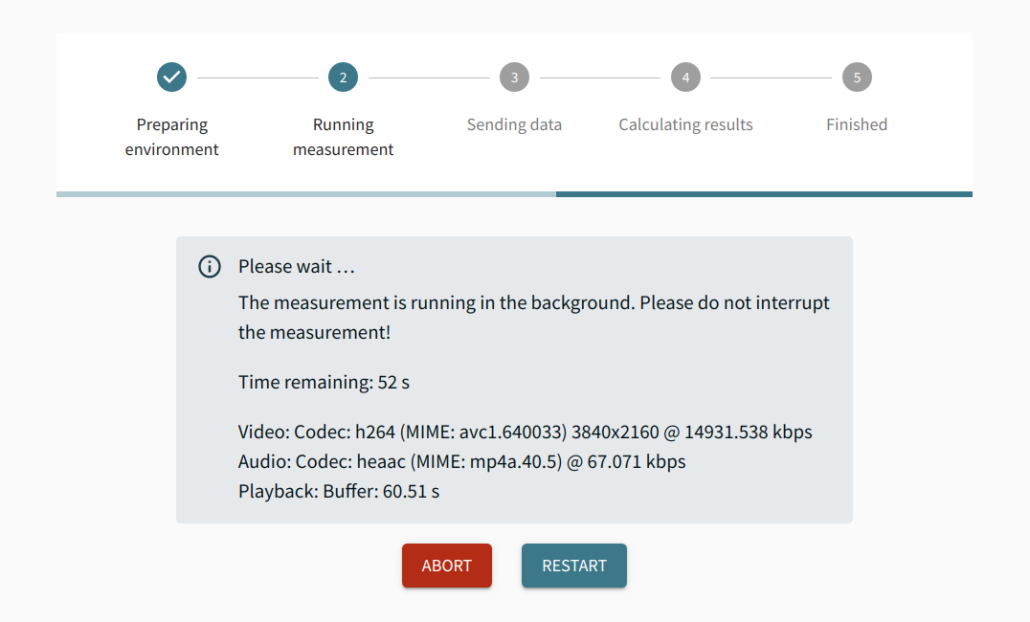
When the video is playing, you’ll get an indication of the current playout format, including codec, resolution and bitrate. This is nice for checking what is happening in real-time.
Once the playback is finished, you’ll see an overview of the calculated performance indicators.
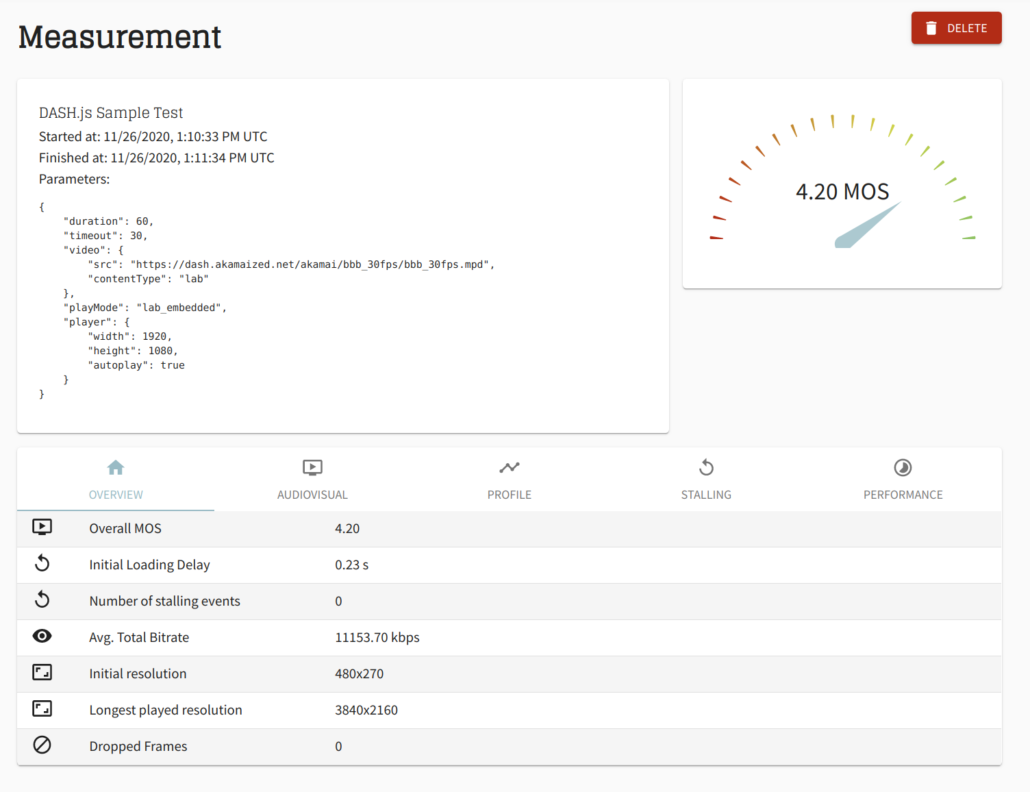
How did it perform? We can see that it took 0.23 seconds for the stream to load, which is very fast. There was no stalling in between, so the video played smoothly. The video started with a resolution of 270p, but for the most part, it played out the stream at 2160p. This is already an interesting finding – the player decided to be conservative and start with a lower resolution, ramping it up while playing. From subjective studies, we know that most people prefer this player behavior over a long initial loading time.
Further KPIs are shown in the other tabs, but we‘ve collected the most important ones in the overview tab for your convenience. We‘ll explore these in another post. Now, we have all these individual metrics, but how would you decide whether that was good or bad streaming performance? Let‘s now look at how you can check the quality of the stream at one glance – through the Mean Opinion Score (MOS).
From Quality of Service to Quality of Experience
Traditional metrics for video streaming are individual indicators relating to one aspect of the transmission, e.g. the loading time. As we mentioned earlier, it‘s hard to integrate all these metrics into one score that would reflect what your customers would think of the stream. Certainly, the average user won‘t even think about the loading time or resolution explicitly, they‘d just be happy or annoyed depending on the streaming performance.
Luckily there’s a concept that combines all technical indicators into a measure of customer experience. Quality of Experience (QoE) is “the degree of delight or annoyance of the user of an application or service” (according to ITU-T P.10 and the Qualinet Whitepaper on Definitions of Quality of Experience). While KPIs are intended for a technical audience, QoE looks at the performance from a customer‘s perspective.
Normally, in order to find out the QoE of a video stream, you‘d have to ask people to rate it, and then average that rating into a Mean Opinion Score (MOS). However, this is quite time consuming and costly. In our solution we employ a QoE model that uses advanced algorithms to estimate the rating of users, without the need to ask them.
The QoE model integrates all technical KPIs into one final MOS score. We consider aspects like the time it took for the video to start playing, whether there were any changes in resolution, what bitrate and codec were used, etc. It would take way too much time to describe the inner workings of that model here, but rest assured that a lot of effort has gone into modeling how humans perceive video in order to meaningfully predict how they would rate a stream.
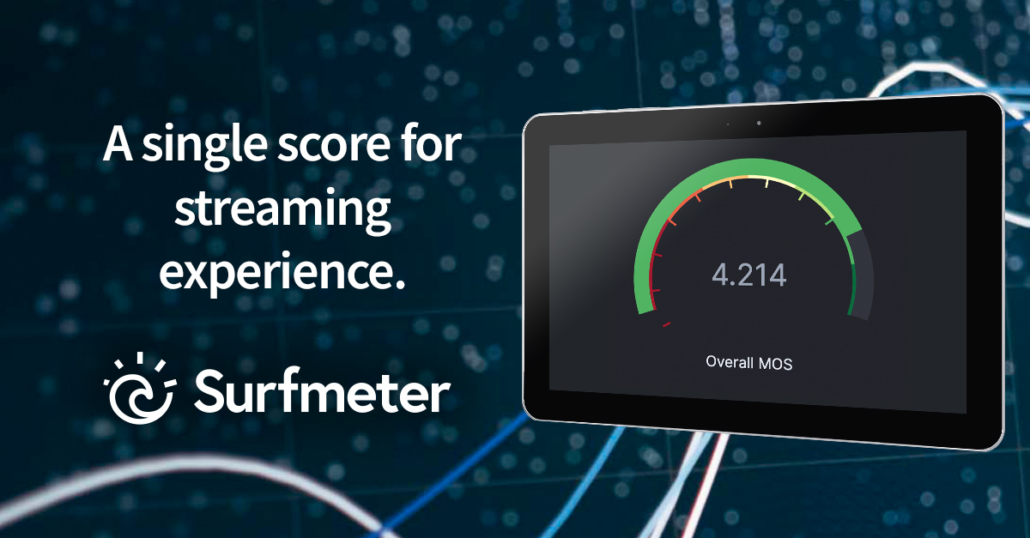
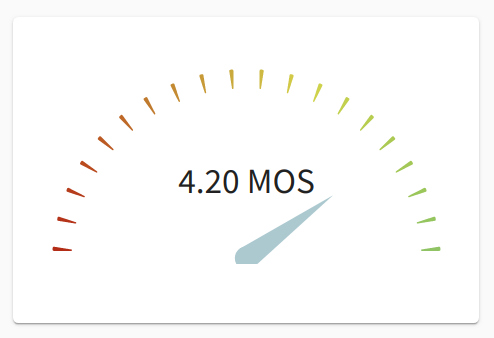
The MOS in our case is a number between 1 and 5, where 1 is bad and 5 is excellent. Note that it‘s almost impossible to reach a straight 5, as there will always be a user who gives a mediocre rating to an otherwise good stream. The MOS gauge shows the number on a colored scale. Here, it’s 4.2, which corresponds to a good rating. This is also expected given the very short initial loading delay and the high bitrate/resolution during playout.
How would you use the MOS? Here are some ideas on how you can use Surfmeter in production or testing:
- If you have multiple video streams that you would like to compare, it‘s easy to look at the MOS to get a first indication of which one performed better. Stream one at a time and compare the results after.
- If you perform multiple measurements throughout the day, you can check whether the quality fluctuates depending on network bandwidth or other factors. Here, we offer an automated solution that can be easily deployed to remote probes.
- You can check different playback algorithms (e.g. depending on buffer behavior) – which one gives the highest MOS score? It‘s usually the one that introduces the lowest amount of stalling and quality fluctuation within the stream.
QoE models adapted to your needs
At AVEQ, we partner with the Audiovisual Technology Group of TU Ilmenau, where leading experts in the field of video QoE modeling are working on developing and standardizing the most recent and technologically advanced models. Together, we have decades of experience in the field.
But why can’t you just use one simple model? As the world of video streaming changes, so do the models that you need to predict QoE. For example, the introduction of new codecs (such as AV1) requires an update of the used model. Higher resolutions like 4K mean that older models can‘t be used directly without adaptation.
Surfmeter is a fully customizable solution, in which we can quickly integrate any adapted QoE model. We’ve already created versions for a customer who had a specific encoding set-up that required changing of the defaults, and we recently included support for AV1 encoding in our products, all thanks to the research conducted at TU Ilmenau.If you‘re interested in checking the performance and QoE of your video services, or measuring how well different popular services (like YouTube) work on your networks, contact us to schedule a demo of our desktop and mobile applications! You can also have a look at our factsheets for some background information.

