How Does WiFi Energy Use Affect Streaming Quality?
If you are using somewhat modern WiFi equipment, you will probably have an option to turn on an “eco” mode. These settings promise to save power at the expense of network speed. But how much does that affect the actual speed and application performance? Luckily, we have our Surfmeter probes to find out. Turns out that the impact can be quite significant. Read on to see how we can accurately measure the impact of power-saving settings on the end user experience!
How We Measure Speed and Streaming QoE
This summer we announced our Surfmeter hardware probe, a capable yet inexpensive mini PC that’s running our entire suite of tests around the clock: video streaming, web browsing, and network speed/ping tests. It’s all done via the headless Surfmeter Automator tool. We deployed our probes to different home setups, with varying Internet products and home connections (Ethernet/WiFi).
In one of our setups, we have a TP-Link Deco Mesh WiFi acting as a local network. The probe is connected via Ethernet to one of a total of four Deco access points; one that is out of sight of the main unit (which is directly connected to the FTTH modem). The owner of the probe was out over the weekend, and he set it to use the “ultra power-saving mode” between 22:00 and 08:00 to save some energy. Here you can see how that option looks like for end-users in their Deco app:
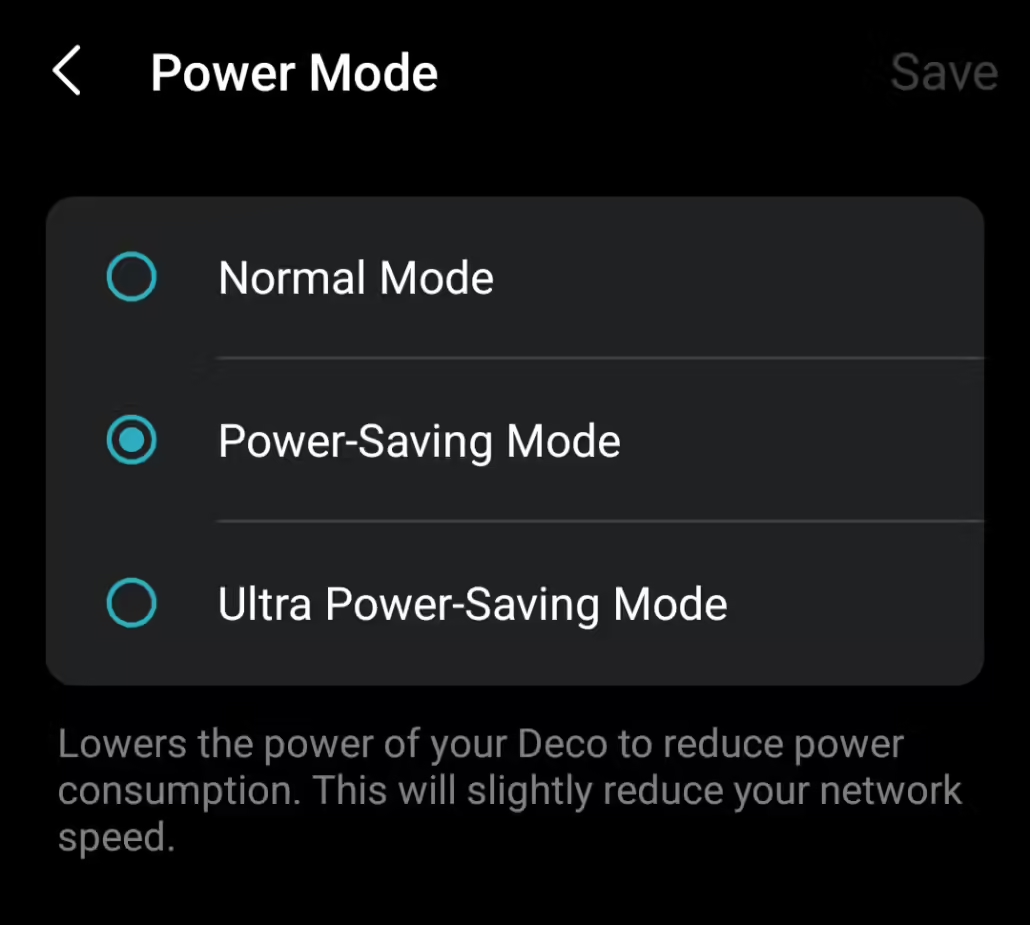
TP-Link Deco settings for different power modes.
In the following, we’ll look at the different results from speed tests and video streaming tests. Bear in mind that this is just a sample of one measurement unit with one particular WiFi setup — but it clearly shows how we might extend that to a lab setup where different hardware is being tested.
How Does the Ultra Power-Saving Mode Affect Speed?
The mode selection for our TP-Link Deco unit makes it clear that network speed will be impacted by choosing a lower power mode. But how much? Let’s look at the baseline first. Here we plot the downstream throughput (as measured via the speedtest CLI tool against the nearest server) over time:
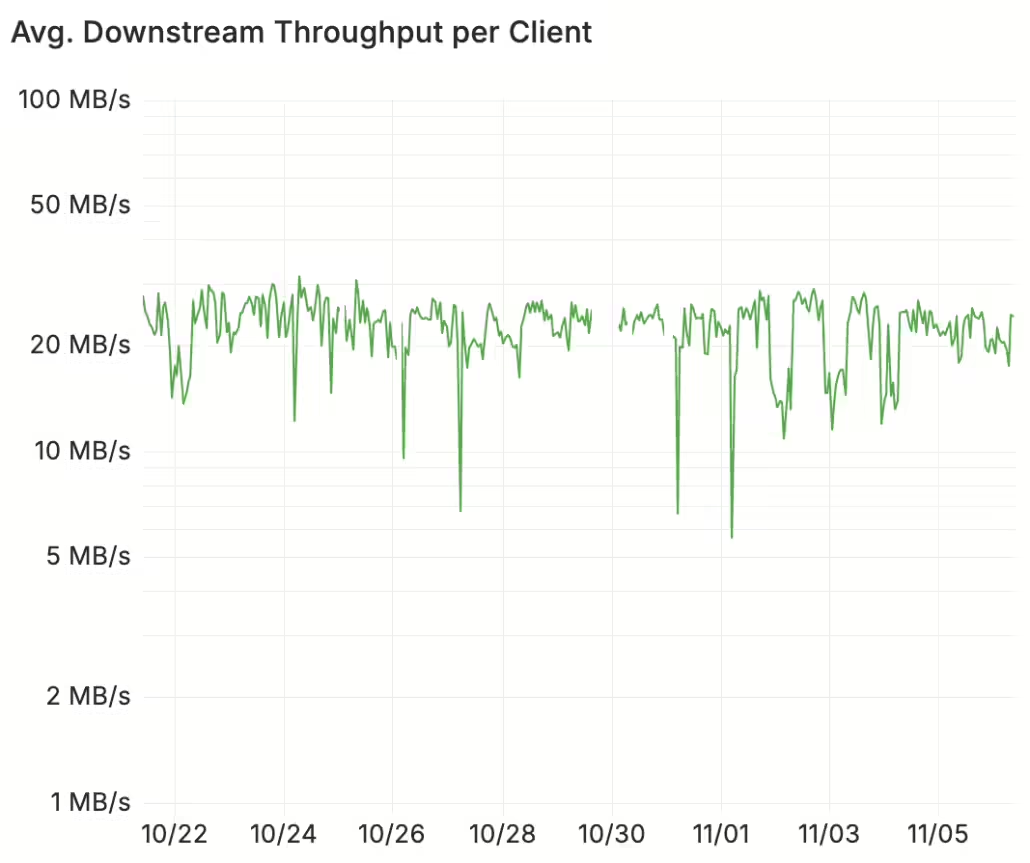
Typical WiFi speeds for our client.
This client gets around 20–30 MB/s on average. Two notes here: first, the units are MB as in Megabytes — that’s because the speedtest tool outputs bytes as throughput unit by default, so it corresponds to about 160–240 MBit/s. Second, the y-axis is scaled logarithmically, as we sometimes do for charts where we expect to see some variation in the lower ranges that we would like to capture visually.
There are some instances where speed drops significantly, but these are single outliers and could be related to other devices on the network being used for, e.g., downloads — remember that this is a home setup and shared across users. But can you spot the times during which ultra power saving mode was activated? Now let’s enhance it, shall we?
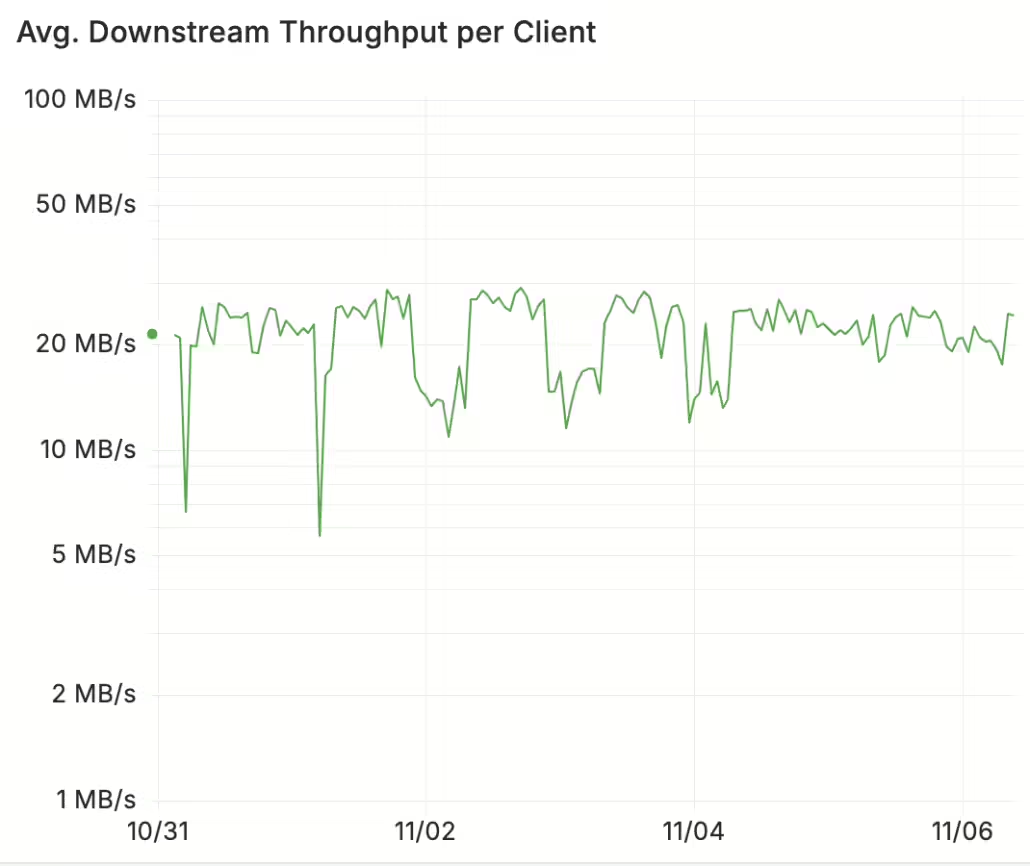
Speeds drop by 50% during ultra power-saving mode.
It was the weekend of All Saints’ Day, and we see that during night times, speeds drop by around 50% to 10 MB/s. That’s quite significant compared to the baseline, and it’s an almost consistently low value during these times. We also have measurements of latency (ping) and jitter against the speedtest server, so let’s look at them in detail for the selected weekend:
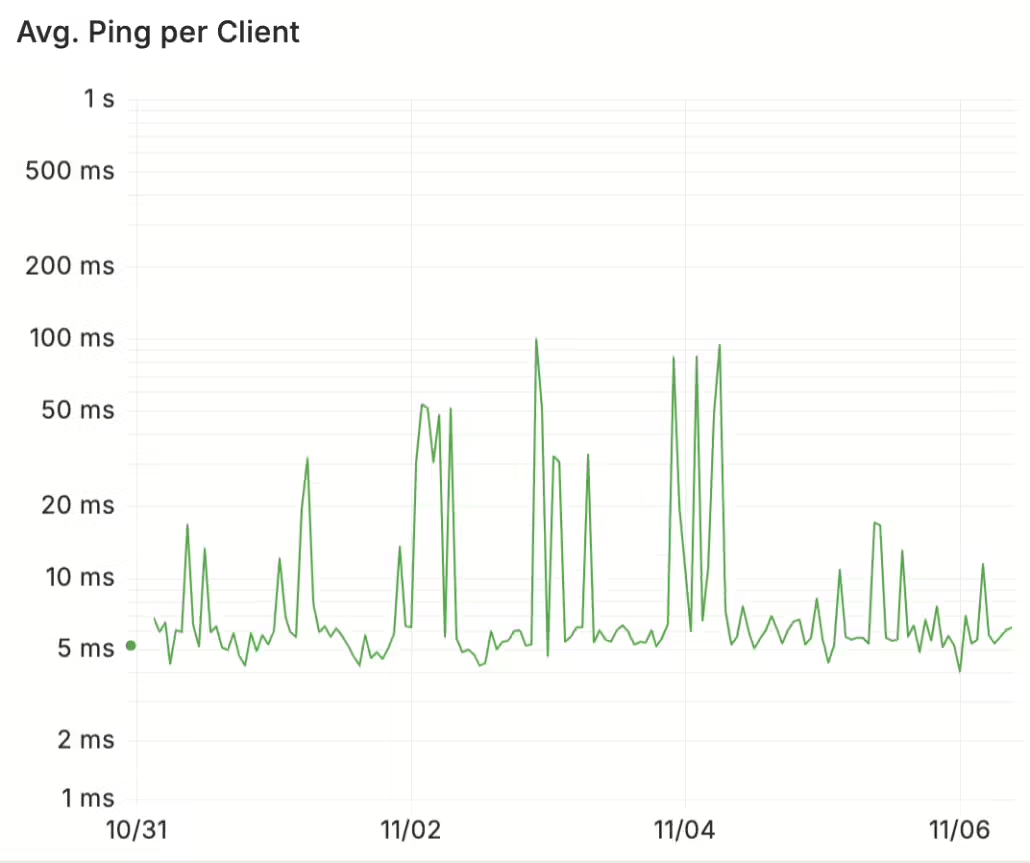
Ping/latency increases from 5–10 ms to 50–100 ms.
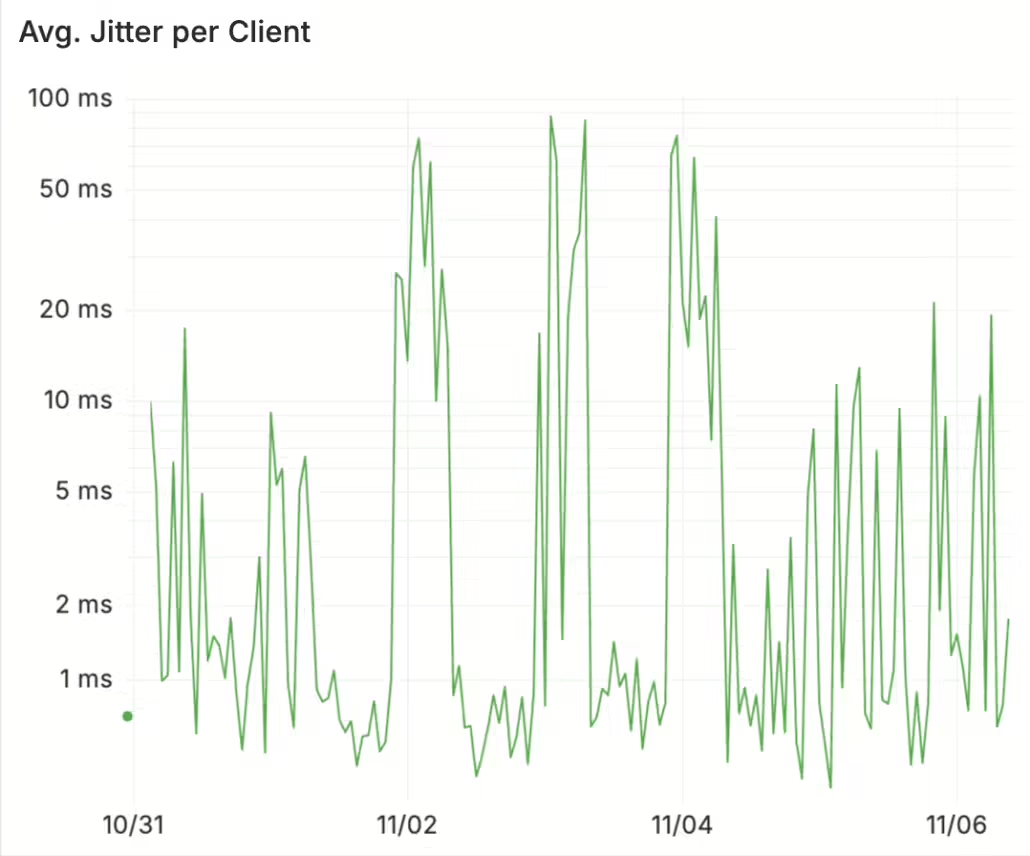
Jitter ranges up to 100 ms as well.
The difference is clear as day and night (no pun intended), since the latency increases tenfold, and the same goes for jitter. We see latencies of up to 100 ms compared to sub-10 ms values in normal operation mode. We’ve established that power saving mode does reduce the network performance significantly — but what about the users? Would they actually notice that? For instance, what if you want to still binge a movie at 23:00? Let’s find out.
How Does Power-Saving Mode Impact Video Streaming QoE?
We cover a wide range of video services in our Surfmeter tool, and for our probes, we’ve enabled only some of these, with a focus on regional providers like the German ARD and ZDF — which are important in the DACH region — and international ones like YouTube, Netflix, and Amazon Prime. Without going into the details of differences between services, let’s have a look at the startup times of the different services over the past two weeks:
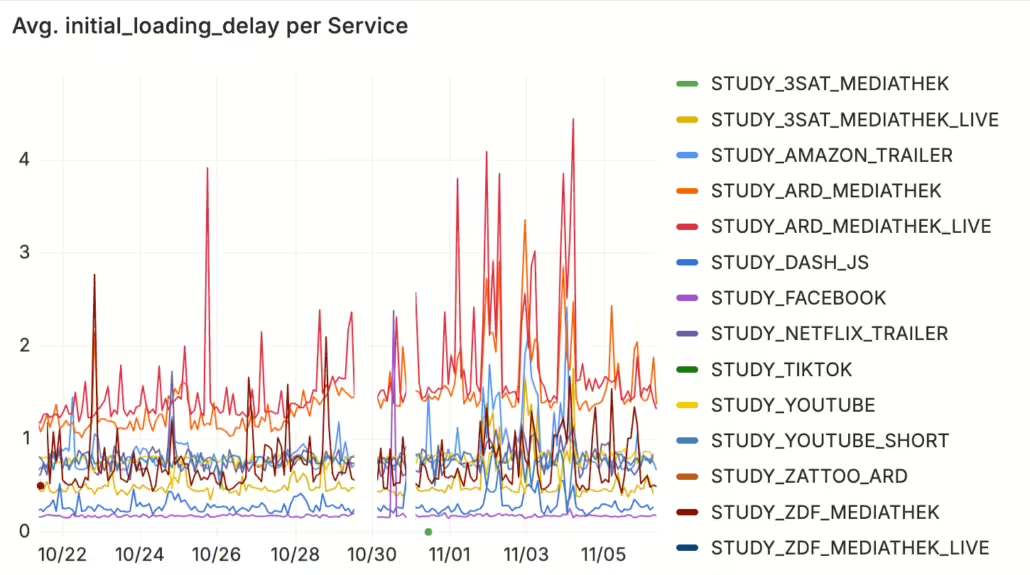
Video startup time (initial loading delay) increases significantly, up to 5 seconds.
The initial loading delay (ILD) for all our video services varies by the time of the day and other factors, but it’s always well below two seconds. The main difference is between the services themselves, which all use different technologies to embed the video stream, load the buffer, etc. — but this is not the main focus here. If you look at the affected weekend, you can see that all but one streaming service are equally impacted by the power saving mode. The ILD values go up to 5 seconds for the ARD Mediathek live stream, for example. Only Facebook is unaffected, but this is due to its video being played only in 360p and thereby not requiring nearly as many resources as other services (which play in 720p or more). To put finding into clearer terms, we averaged all services in the following graphic:
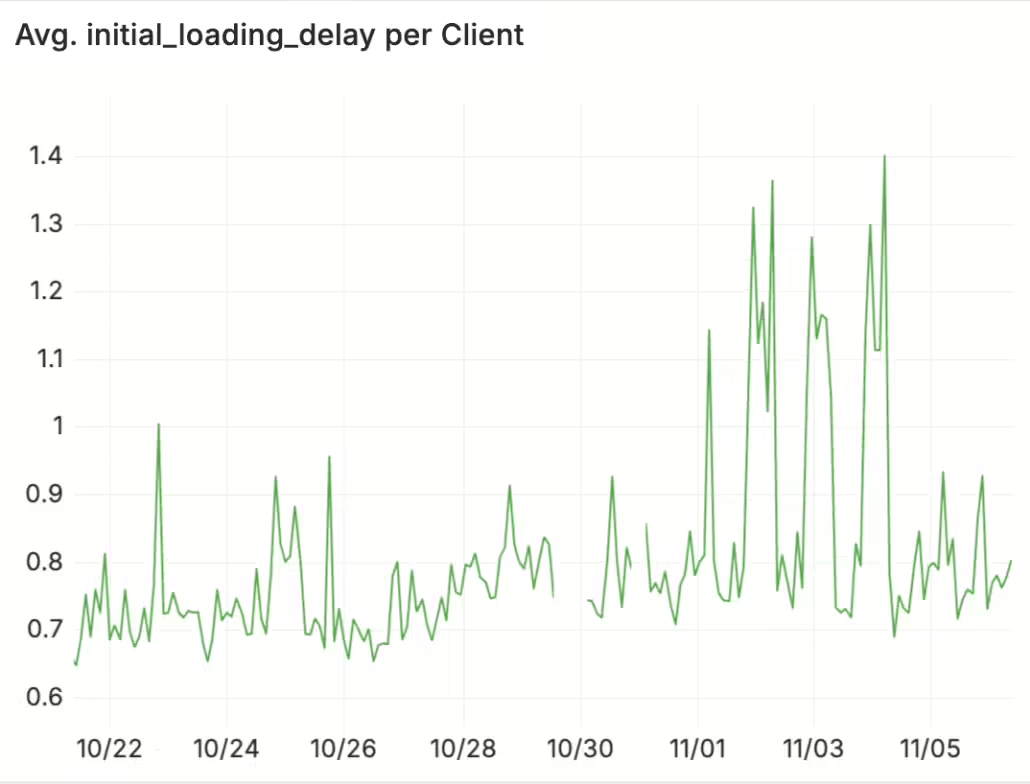
Average initial loading delay variations over time.
Now, it’s much more visible how an average user might be affected by these settings. Subsecond initial loading delays now become twice as much. As we know from various subjective studies on that topic, startup times are critical to user engagement, and increases beyond a few seconds may cause users to become frustrated and abandon the stream. In some cases, they might even blame their ISP for these types of problems, even though the ISP is not at fault.
To see the overall impact on user experience, we turn to our video QoE model, which calculates a single Mean Opinion Score (MOS) that reflects the overall QoE on a scale from 1–5. The following chart shows the MOS value drops, which are more pronounced for some services, and less so for others.
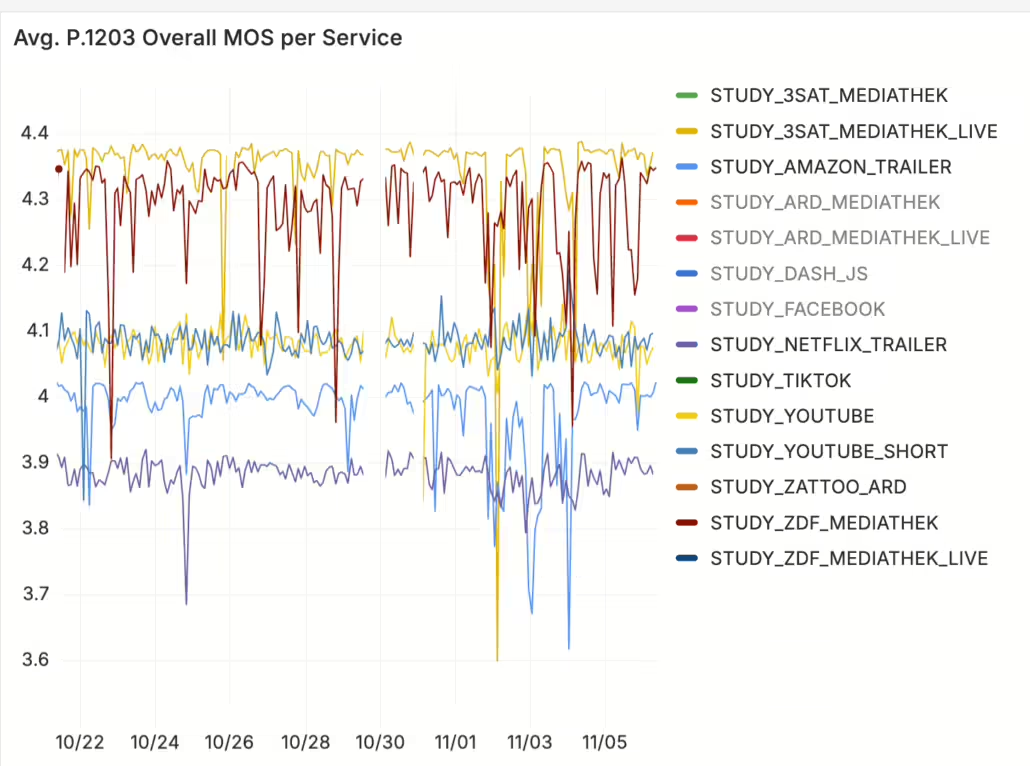
MOS varies significantly depending on the service and power-saving mode.
In this graphic we’ve excluded some services that would make the lines unreadable otherwise. You can see Amazon and ZDF Mediathek being affected the most by the power-saving settings. Other services appear to run more stable in the sense of not showing visible impacts on the MOS. For context, you can assume that a MOS below 4 (i.e., from the range “good/excellent” to “fair/good”) will already cause a noticeable degradation for most users that, if left unsolved, could cause customer churn.
Did We Actually Save Energy?
The above measurements were a finding we made after the fact — we have yet to measure the actual power consumption for the Deco mesh unit in its different settings. However, we do have a measurement of the energy use for the entire household based on a smart meter whose data we can export later on. This is shown in the following graph for one of the affected days where nobody was at home:
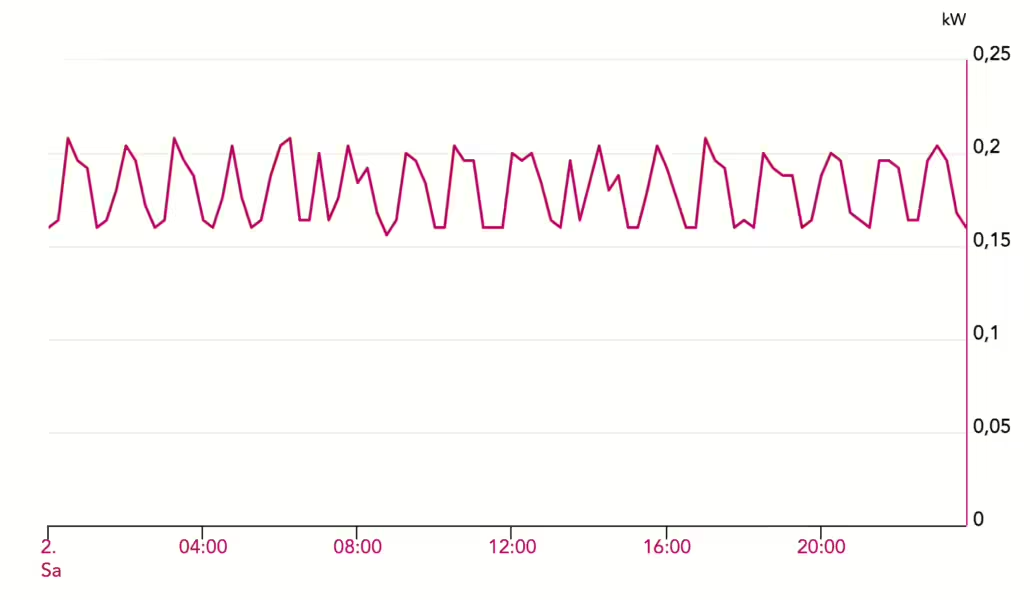
Energy use over time for one of the days of the weekend.
You can see … well, there is not much to see. This is a normal household, where, in the absence of any people using electrical appliances, there are only few devices drawing power: an Internet modem + WiFi, plugged-in chargers, units in standby mode (e.g., a printer), and so on. The oscillations in the energy use are caused by — you may have guessed it — the fridge/freezer unit. If ultra power-saving mode really caused a significantly lower energy consumption, it would have been visible in the times between 22:00 and 08:00, yet, we see no such impact. The average energy draw is between 150 and 200W.
We checked the power consumption of one Deco unit and measured that to be 4–5W, based on a reading from a Tapo smart plug, as you can see in the following graph.

A single Deco WiFi unit uses 4–5 Watts.
The readings do not significantly change throughout the day. We also could not observe significantly lower readings when enabling the ultra power saving mode, or switching back to normal power mode. This may have to do with the positioning of the devices, which are all quite near to each other, and so they’re operating on low transmit power all the time. Remember that a strong signal can be maintained over shorter distances with less power.
Some Thoughts and Conclusions
Of course, with such specific WiFi settings, users have made deliberate choices about their network performance. It’s unlikely that they would blame their ISP or video provider for issues arising from local network performance problems. The Deco application is also very clear about the fact that there will be expected performance impacts. Still, what if you have users on your network that are not aware of these settings having been made? Or what if you simply forget about them?
The impact of low-level network settings on actual application experience should be easier to understand for end-users. For example, your average customer does not know about nominal WiFi link speeds (“up to X MBit/s”), beam forming, link bands, or RSSI values. They care about effective download speeds, or whether their applications feel slow or not.
Having more detailed power measurements for the Deco unit would be the next step for more accurate joint energy/QoE measurements. This would allow us to compute a measure of “bits saved per Watt”, or even “video quality per Watt”, which could enable providers to make better claims about what you gain from enabling such “eco” modes.
We could also imagine that at some point, a power-saving mode will become the default (or at least the suggested mode of operation), like we’ve seen for dishwashers or washing machines — but unlike in the world of entertainment, we have no time to trade against energy efficiency. While you probably don’t care if your dishes are done in three hours or one hour, you will definitely notice if your video starts up in less than a second or three. It is worth it for the low amount of energy saved? This is still to be discussed.
If a tree falls in the forest, does it make a sound? If your WiFi is slow but no one uses it, does it matter? In the grander scheme of things, it’s probably better to invest in a new fridge, but even tiny amounts of energy saved can help if you think about the millions of routers in use by households.
Consumers pay a lot of money for Internet access and streaming, with the bottleneck often being their home setup rather than the access network itself. Our results show that you need dedicated tools to clearly measure low-level network speeds and high-level application QoE at the same time, to get a deep understanding of how different technologies and settings impact the final customer experience. Get in touch if you want to find out more about how we can help you measure your technology and its impact on application QoE!


