
When Do Users Perceive Stalling in Video Streaming?
TL;DR: The minimum detectable stalling duration in video streaming is between approximately 80 and 200 milliseconds, for most viewers.
One of our customers recently asked about some possible video measurement artifacts: streams that ran into a lot of minor stalling events. That is, video rebuffering shortly, as indicated by the HTML5 video player’s event timeline. Their question was: do users notice these stallings at all? In particular when they’re as short as 100 ms, or less? Initially, we couldn’t provide an immediate answer, but we settled on a default filter to eliminate stallings of <100 ms from our statistics.
We wanted to go deeper and understand what really happens on a psychophysical level — do viewers even notice 100 ms of stalling? Are they more sensitive than that? Or does it really not matter?
To find out, we searched for academic studies, and we found some interesting results. Read on to discover what we learned about stalling detection thresholds, and the importance of knowing the context (content motion, scene context, and viewer attention) to decide whether to consider them or not.
Think about the last time you experienced buffering while streaming: it was probably very frustrating. Research generally agrees with that. Stalling of several seconds length can cause high abandonment rates (e.g., as shown here). But what about minor stallings that are visible very briefly? The video might appear to stutter. Or you might not notice at all. It may be caused by adaptive bitrate algorithm issues or player bugs, or timing issues on the network request level (e.g., stemming from improper CDN configuration or caching setup)… but do viewers actually notice it or not? Here’s what we found.
The INTENSE Study: First Direct Measurement of MNSD
When we did our search on ResearchGate and Google Scholar, we found the probably mostly directly relevant paper by Taraghi et al. (2021), called: “INTENSE: In-Depth Studies on Stall Events and Quality Switches and Their Impact on the Quality of Experience in HTTP Adaptive Streaming,” published in IEEE Access. This paper from the well-known ATHENA lab at Alpen-Adria-Universität Klagenfurt is the only study we found that explicitly defines and measures a “Minimum Noticeable Stall Duration” (MNSD) for HTTP Adaptive Streaming.
Their subjective evaluation campaign, conducted via crowdsourcing, asked viewers watching HAS content to report whether they noticed stall events of varying durations. A “Capture Stall Event’” button should be pressed each time a stall event occurs. The key results from their MNSD experiment are:
- Below ~4 ms: All subjects missed the stall event — 0% detection rate
- Below ~301 ms (0.301 s): The percentage of noticed stall events begins declining; here the detection is no longer universal
- Above ~301 ms: Most participants reliably notice the stall
Notably, the detection curve follows a sigmoidal shape — it’s one that we find very frequently in psychometric functions. However, because the researchers used crowdsourcing, this approach, while it appears ecologically valid in terms of obtaining detection thresholds, likely yields somewhat higher thresholds than what a controlled lab would produce, where you have rigorous test conditions.
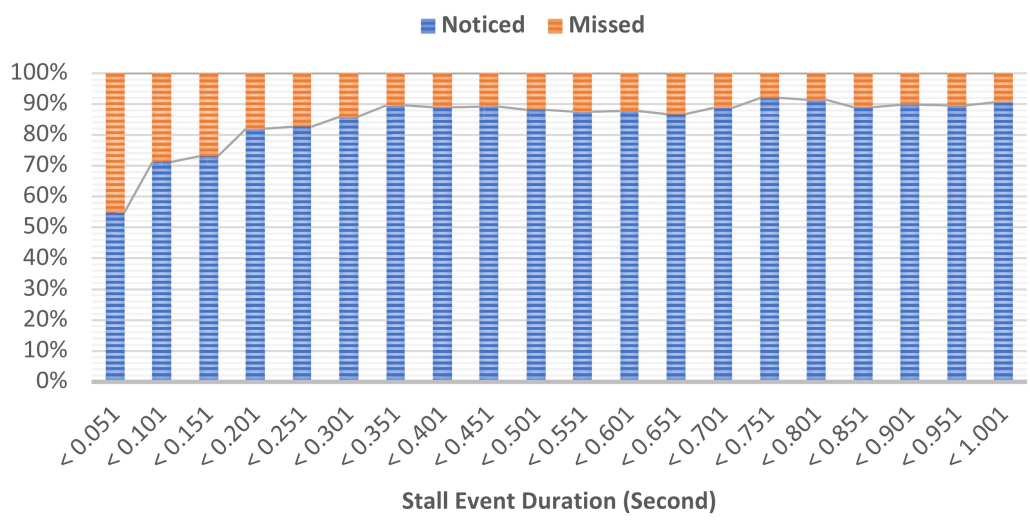
Stalling noticeability from the INTENSE study paper (CC BY-NC-ND 4.0).
Psychophysical Thresholds: One Level Deeper
The most methodologically rigorous work on temporal discontinuity detection in video comes from Pastrana-Vidal et al. (2004), “Sporadic frame dropping impact on quality perception,” published in SPIE Human Vision and Electronic Imaging. The authors used a 4-alternative forced-choice (4AFC) psychophysical paradigm on natural video content at 25 fps (PAL).
Slight excursion here: 4AFC means that subjects are shown four representations of a stimulus. Only one contains the actual degradation. The subjects are asked to identify which one it is. If they get it right, there’s a higher likelihood of them not guessing at random, because a random choice would have a 25% chance of being correct vs. the 50% with a 2-alternative forced-choice (2AFC) method.
Their detection probability findings give us more evidence:
- ~80 ms burst of dropped frames: near detection threshold for many content types; minimal quality impact
- 160 ms burst: above detection threshold; reliably detected by most observers
- 200 ms burst: 100% detection rate — every observer detects the discontinuity regardless of content
The detection probability curve rises sharply between ~80 and 200 ms, following a logistic function. This, again, is a very well known function behavior in psychophysics. Most importantly, the researchers found that detection thresholds are content-dependent: high-motion content like sports has lower thresholds (freezes are easier to detect), while low-motion content means users can tolerate longer disruptions before detection.
A companion paper by the same researchers, Pastrana-Vidal et al. (2004) also investigated temporal masking near scene cuts: forward masking hides frame drops for approximately 30–100 ms after a scene change, and backward masking extends up to ~80–200 ms before a scene change. This means stalling events that coincide with scene transitions are substantially less detectable.
Finally, Van Kester et al. (2011) contributed threshold data, finding that the acceptable freezing time — where Mean Opinion Score remains above 3.5 — is approximately 0.36 seconds (360 ms) for a single freeze event. There was no perceptual difference between frame halts (freeze-then-resume) and frame drops (freeze-then-skip), although that is something we believe should be reinvestigated with current live streaming setups. One caveat is that they only tested freezes of 120 ms or longer, so we can’t use these results to investigate lower detection thresholds.
The Human Visual Temporal Resolution Floor?
The psychophysics of temporal vision can establish hard lower bounds on what the visual system can actually resolve. One could measure this by introducing flickering and then increasing the frequency of the flickering until it is no longer visible. The Critical Flicker Frequency (CFF) under such conditions averages 60 Hz. This implies an underlying temporal resolution in our human visual system of ~17 ms. However, CFF measures sensitivity to luminance flicker, not motion discontinuity. These two are related, but distinct perceptual tasks. And the latter is much closer to real-life consumption of streaming video, so these results are to be taken with a grain of salt.
Tsoneva et al. (2023) have written about Temporal Contrast Sensitivity Function (TCSF). It describes how sensitive humans are to contrast changes, which peaks at 8–20 Hz under typical viewing conditions. This would mean a temporal period of 50–125 ms. This peak sensitivity window is highly relevant: a video freeze converts a dynamic temporal signal into a static one, and the visual system is maximally sensitive to temporal modulations in exactly this range.
So, if we want to find the lower end of the scale, the research suggests a much lower detection floor.
But: Attention and Context Shift the Threshold
Levin and Varakin (2004), in “No pause for a brief disruption: failures of visual awareness during ongoing events” (Consciousness and Cognition), showed that the majority of subjects reported no awareness of blank-screen disruptions lasting 200, 400, or even 600 ms when they were engaged in processing a meaningful ongoing event. This is a fascinating result: interruptions that are 100% detectable in forced-choice paradigms can be completely missed under naturalistic viewing when attention is engaged with content.
Now consider that currently, movie dialogs are being rewritten to repeat them because nobody’s paying attention: “And it wouldn’t be terrible if you reiterated the plot three or four times in the dialogue because people are on their phones while they’re watching,” says Matt Damon.
This implies that stalling detection operates on at least two distinct levels. Sensory detectability (can the visual system resolve the discontinuity?) follows the psychophysical thresholds described above, with reliable detection above ~160–200 ms. Attentional awareness (does the viewer consciously notice the stall?) depends heavily on engagement, content interest, and cognitive load.
What Does the Industry Say?
Industry standards and platforms have settled on operational freeze definitions that roughly align with the psychophysical evidence. For instance, the WebRTC standard defines a freeze event when the interval between rendered frames exceeds max(3× average frame duration, average + 150 ms).
Industry engagement data from Conviva and Mux consistently shows that rebuffering events exceeding 2 seconds trigger significant viewer abandonment. These operational metrics, however, address business impact rather than perceptual thresholds.
Conclusion
The perceptual detection threshold for video stalling events sits in the 80–300 ms range, with the actual value depending on content motion, scene context, temporal masking from cuts, and viewer attentional state.
Under controlled (forced-choice) conditions, ~200 ms represents a hard ceiling. All observers should detect the disruption in that case. Under naturalistic viewing conditions with engaged attention, even disruptions of 200–600 ms could escape our awareness entirely. It probably just depends on whether we’re doomscolling on our phone while watching the movie on the big screen.
For engineering purposes, the WebRTC threshold of ~180 ms appears well-calibrated to the available perceptual evidence and represents a reasonable practical boundary between imperceptible and detectable stalling events. Below this, stalls are very likely invisible to most viewers; above it, detection probability rises rapidly.

